Pie Chart Slide for Status of Service Technology Development
RJ0300065_10
- Last Update 05/06/2025
- File Size 1MB
- # of Slides 2
- File Format PPTX
- Slide Ratio 16:9
- Color
Keywords
- #Content-Based Slides
- #Design-Based Slides
- #Product/Service Introduction
- #Market and Competitor Analysis
- #Graph
- #Other
- #Development Status
- #Market Analysis
- #Circles
- #Pie Chart
- #Mockup
- #16:9
- #pie chart PowerPoint slide
- #pie chart template download
- #data visualization slide
- #3-segment pie chart
- #graph PowerPoint template
- #business data presentation
About the Product
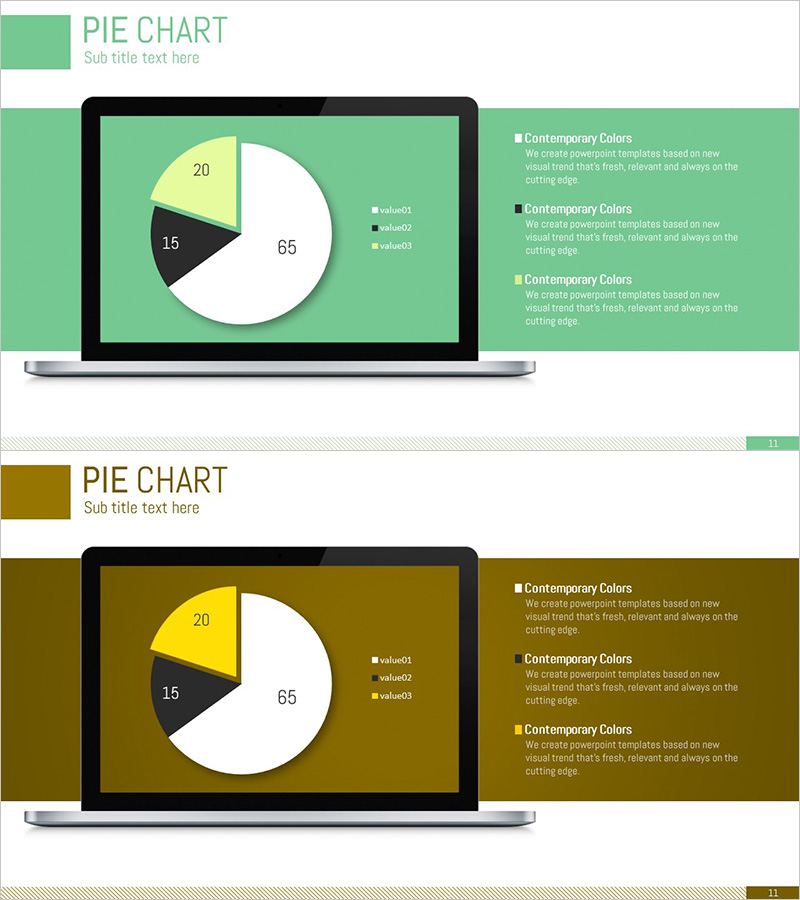
A professional pie chart PowerPoint slide displaying service technology development status across three segments. Featuring a mint green background with a white pie chart and yellow and black accent segments, this slide is optimized for market analysis, competitive comparison, and technology status presentations. The 2-slide set includes an alternative dark gold version to match corporate branding preferences. Each slide has clearly defined data entry areas and legend placement for easy updates, making it ready for immediate use in presentations, reports, and business communications.
Usage Points
-
Main Usage
Visualize the composition and proportion of three data categories—such as service technology development status, market share, or competitive positioning—in a single, intuitive pie chart. The segmented design allows viewers to instantly grasp the relative size of each component, making it ideal for quantitative reporting in technology briefings, business reviews, and marketing strategy presentations.
-
How to Use
Simply enter your data values and category labels into the pie chart segments and legend areas. The mint background version conveys freshness and optimism, while the gold background version projects premium quality and executive confidence. All colors, fonts, and values are fully editable to align with your corporate identity and presentation standards.
-
Recommended For
Marketing teams presenting market analysis, technology teams reporting development progress, executives summarizing business performance, consultants analyzing competitive landscapes, and startups pitching to investors. Ideal for any data-driven business presentation requiring clear proportional representation of three key metrics.
-
Slide Structure
Two-slide layout with color block header (top left), centered laptop mockup displaying a 3-segment white pie chart (yellow 20%, black 15%, white 65%), and right-aligned legend with descriptive text. Each segment includes editable data entry fields and percentage labels for seamless customization.
Related Products
-

Medical Analysis Pie Chart – Visualization of Market Trends
#Product/Service Introduction #Market and Competitor Analysis #Graph
-

Market Share Analysis Area & Pie Chart – The Power of Data Visualization
#Product/Service Introduction #Market and Competitor Analysis #Graph
-

Manufacturing Analysis Graph – Market and Competitive Analysis
#Product/Service Introduction #Market and Competitor Analysis #Graph
-

Online Presentation Template - Pie Chart & Radar Chart
#Product/Service Introduction #Market and Competitor Analysis #Graph
