Business Area Overlap Diagram – Integration of Strategy and Vision
RJ0300065_9
- Last Update 05/06/2025
- File Size 0.2MB
- # of Slides 2
- File Format PPTX
- Slide Ratio 16:9
- Color
Keywords
- #Content-Based Slides
- #Design-Based Slides
- #Business Introduction
- #Business Vision and Strategy
- #Diagram
- #Business Areas
- #Business Overview
- #Cluster
- #Combination Diagram
- #Chain Diagram
- #16:9
- #overlapping Venn diagram PowerPoint
- #business area diagram slide
- #cluster diagram template
- #strategy vision presentation
- #intersection diagram PPT
- #how to create Venn diagram in PowerPoint
About the Product
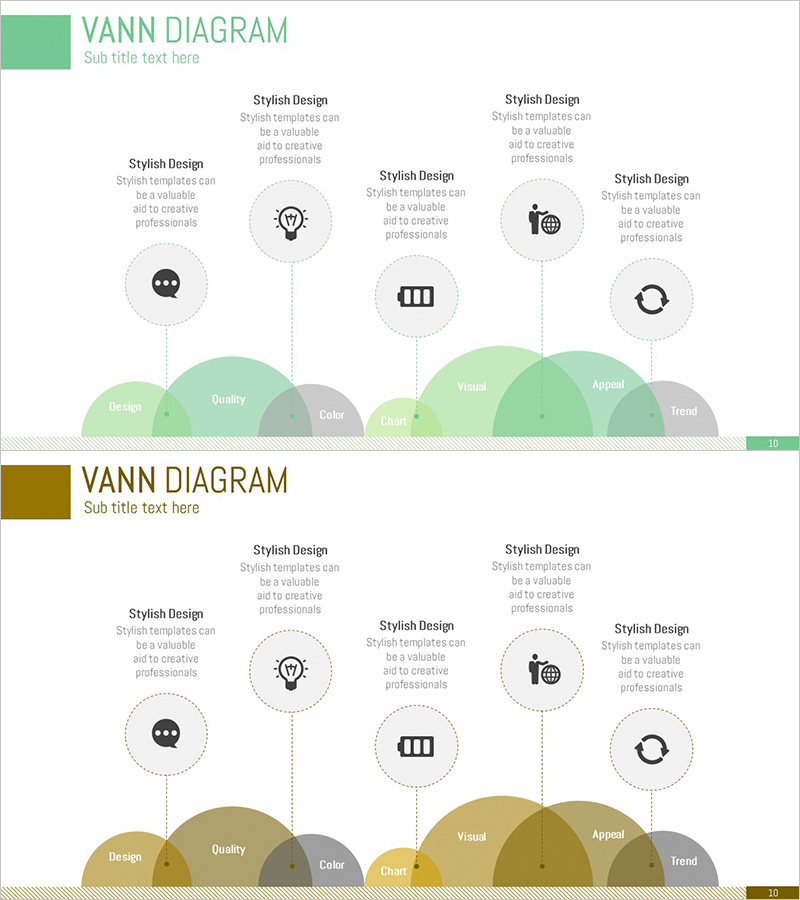
A multi-layered Venn diagram PowerPoint slide that visualizes the intersection of business strategy and organizational vision. Six overlapping semicircular areas represent key elements such as Design, Quality, Color, Chart, Visual, Appeal, and Trend, clearly showing their relationships and convergence points. Icons and text labels structure information for immediate use in executive presentations, strategic planning sessions, and business development decks. The 16:9 widescreen format includes 2 slides with dual color themes (mint green and olive brown) that can be customized to match corporate branding and edited for specific business contexts.
Usage Points
-
Main Usage
Designed to visually represent the intersection and interaction between organizational core values, business domains, and strategic elements. Perfect for executive meetings, strategy presentations, and business model explanations where complex relationships need intuitive visual communication.
-
How to Use
Input organizational core elements (strategy, vision, values, capabilities) into each semicircular area, and add convergence points or synergy effects in overlapping sections. Customize icons and colors to match corporate branding, then insert into executive reports or strategic presentation decks.
-
Recommended For
Ideal for executives, strategic planning teams, business development managers, and consultants explaining multi-layered organizational value structures and business domain relationships. Particularly effective for corporate strategy development, new business planning, and organizational transformation presentations.
-
Slide Structure
Six semicircular areas overlap at the bottom, with icons (speech bubble, lightbulb, globe, battery, circular arrows) and text labels positioned above each area. Upper section contains descriptive text boxes for each area connected by dotted lines. Provided in two color themes: mint green and olive brown for flexible brand adaptation.
Related Products
-

Business Overview and Area Diagram – Blue and Orange
#Business Introduction #Business Vision and Strategy #Diagram
-

Business Area Diagram – Cluster Approach
#Business Introduction #Business Vision and Strategy #Diagram
-

Business Background and Necessity Slide with Diagram
#Business Introduction #Business Vision and Strategy #Diagram
-

Presentation Template Highlighting Business Necessity – Effective Message Delivery
#Product/Service Introduction #Business Introduction #Business Vision and Strategy
