Business Analysis Area Type Graph – The Core of Data Visualization
RJ0300065_6
- Last Update 05/06/2025
- File Size 1MB
- # of Slides 2
- File Format PPTX
- Slide Ratio 16:9
- Color
Keywords
- #Content-Based Slides
- #Design-Based Slides
- #Product/Service Introduction
- #Diagram
- #Other
- #Features
- #Composition
- #Cluster
- #Other
- #Closed Cluster Diagram
- #Area Chart
- #Mockup
- #16:9
- #area chart PowerPoint
- #area chart slide template
- #data visualization PowerPoint
- #stacked area graph
- #PowerPoint chart slide design
About the Product
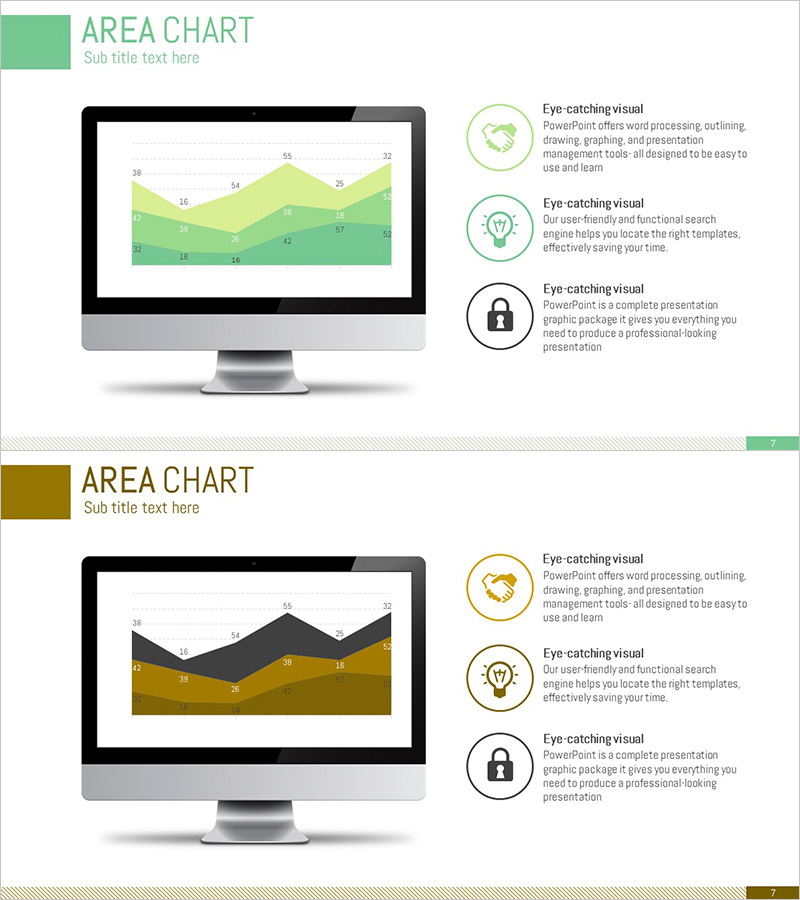
An area chart PowerPoint slide optimized for business analysis and data visualization. The three-series area chart in green, yellow, and light green colors intuitively displays data trends and cumulative ratios over time. Designed for 16:9 widescreen format with 2 slides, it includes a monitor mockup to present your presentation screen in a realistic context. Each slide features numeric labels and legends for immediate editing, making it ideal for reports, proposals, and analysis materials when explaining performance trends, market changes, and cost structures.
Usage Points
-
Main Usage
Designed to display cumulative data changes over time and the proportional relationships between series at a glance. Color gradients in the area chart clearly distinguish data layers, while numeric labels enable precise value communication.
-
How to Use
Use in quarterly revenue trend reports, marketing channel growth dashboards, and financial cost composition analyses. The monitor mockup slide allows you to preview your actual presentation screen before delivery.
-
Recommended For
Recommended for finance, marketing, and strategic planning teams presenting regular reports and analyses. Supports data-driven decision-making in executive briefings, investor presentations, and internal performance-sharing meetings.
-
Slide Structure
2-slide set: Slide 1 displays a 3-series area chart (green, yellow, light green) in a monitor mockup; Slide 2 presents a brown-toned area chart variation. Both slides include numeric labels, legends, and text description areas for customization.
Related Products
-

Configuration Product Feature Guide – Diagram Based Introduction
#Product/Service Introduction #Diagram #Features
-

Diagram Slide for Cell Phone Service Configuration Details
#Product/Service Introduction #Diagram #Features
-

Data Analysis System Configuration Contents – In-Depth Understanding
#Product/Service Introduction #Diagram #Features
-

Pegboard Illustration Diagram – Product Characteristics and Composition Introduction
#Product/Service Introduction #Diagram #Features
