Building Presentation Template – Visually Striking Design
J0900018
- Last Update 02/28/2025
- File Size 61.6MB
- # of Slides 30
- File Format PPTX
- Slide Ratio 16:9
- Color
Slide Preview


Keywords
About the Product
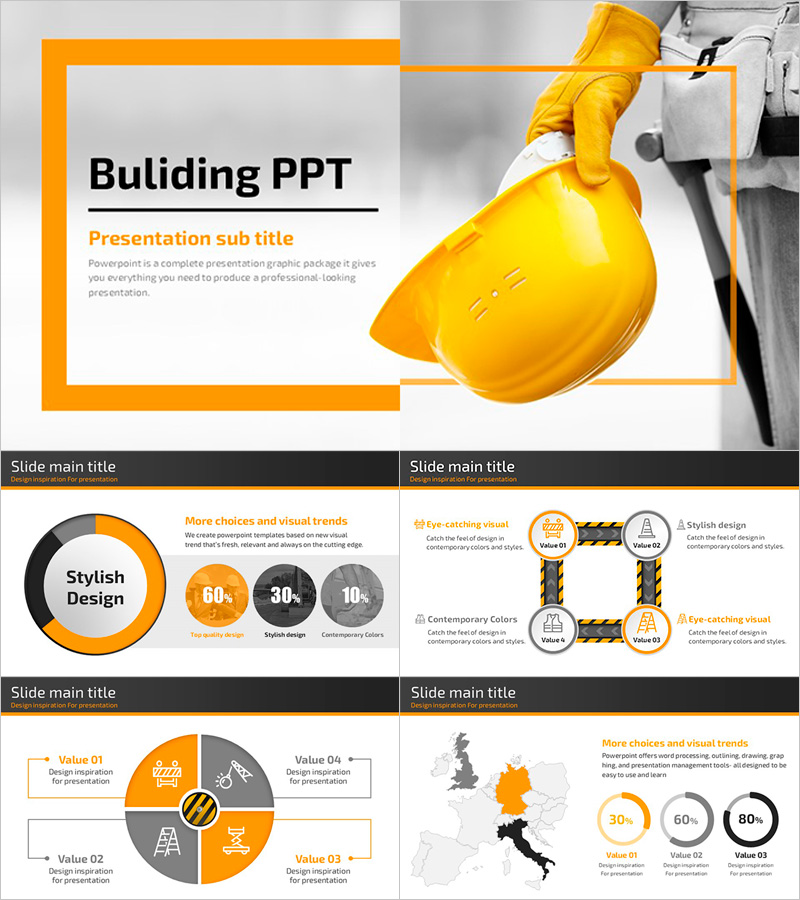
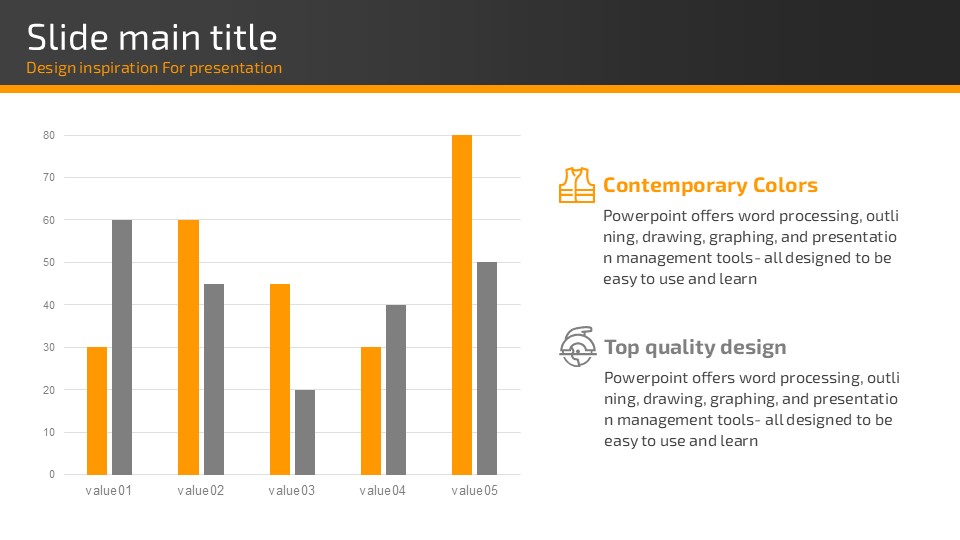
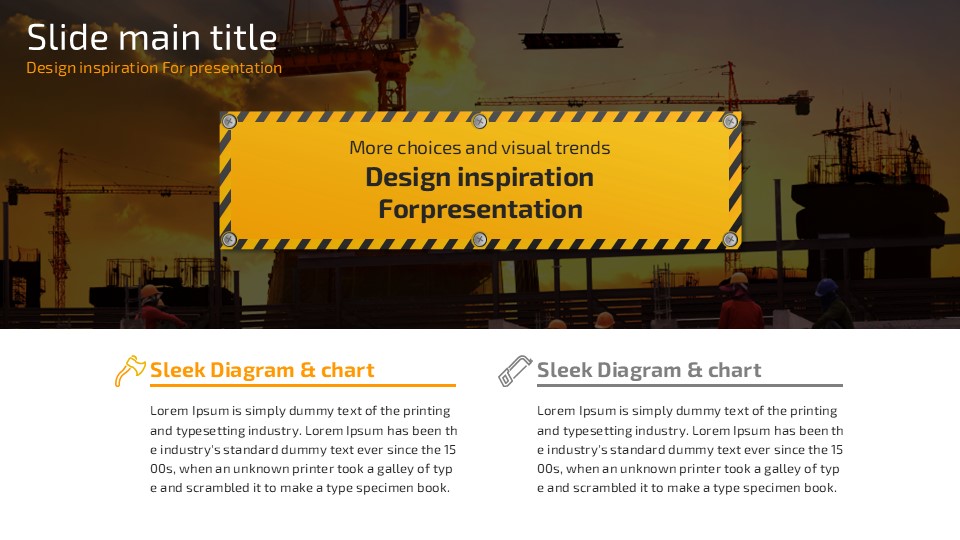
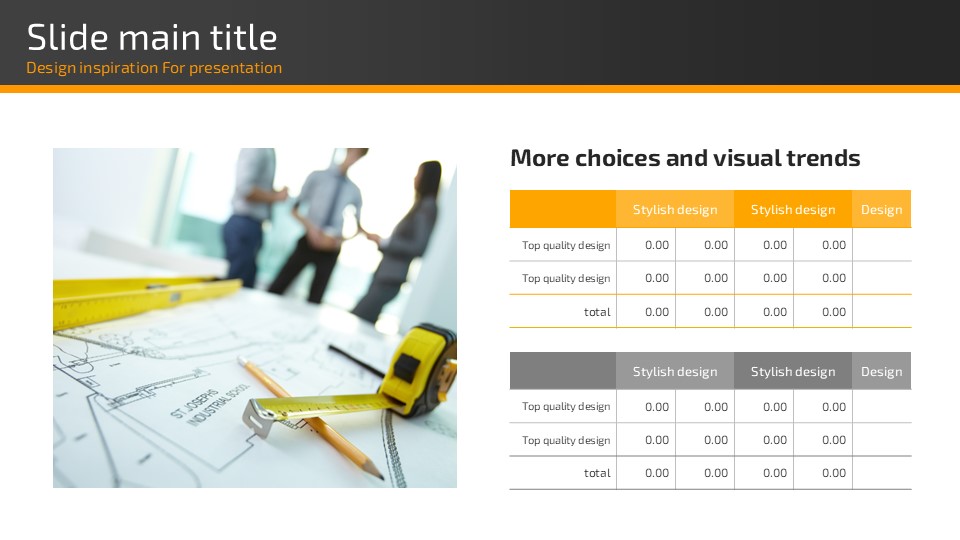
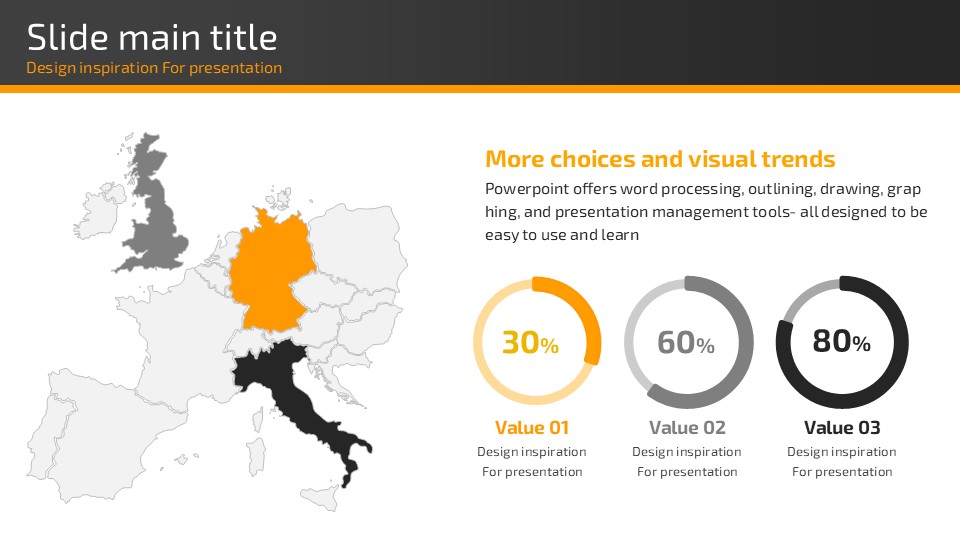
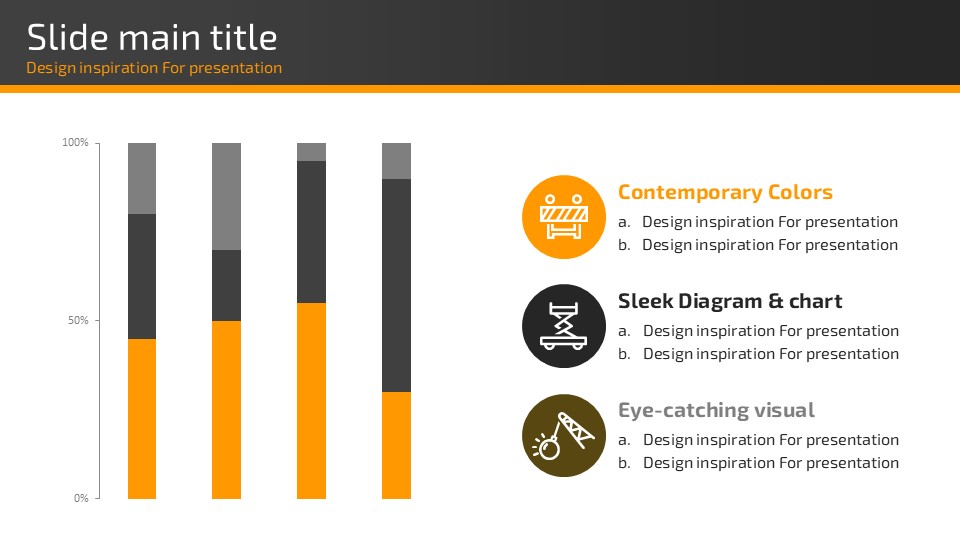
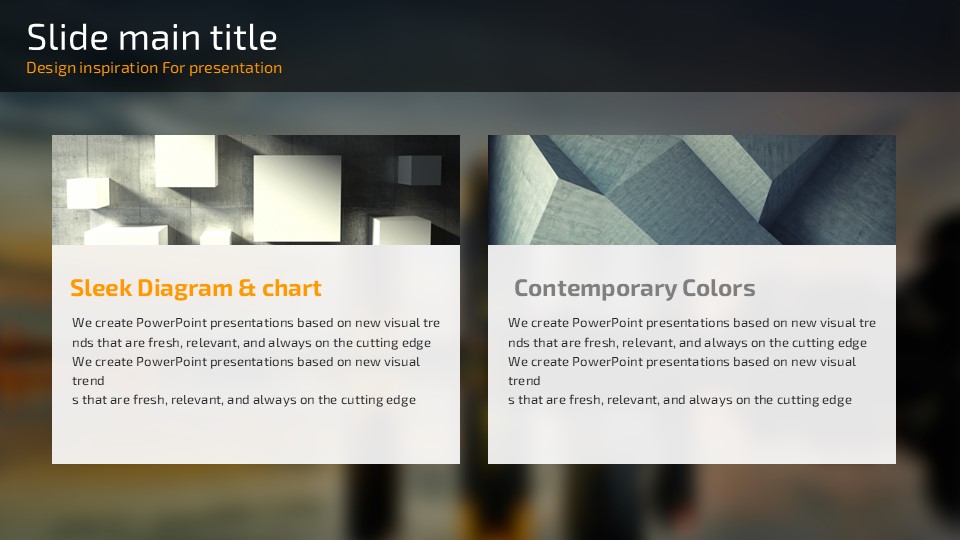
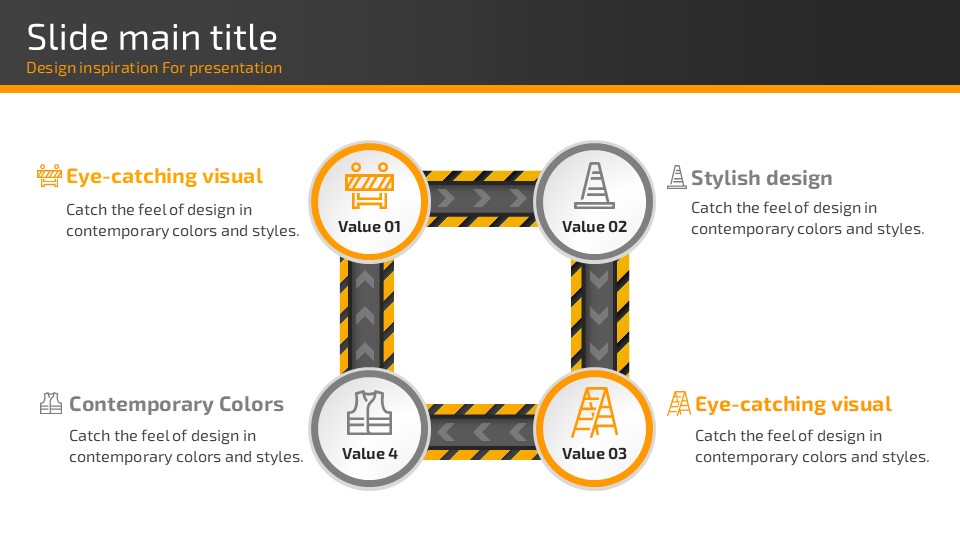
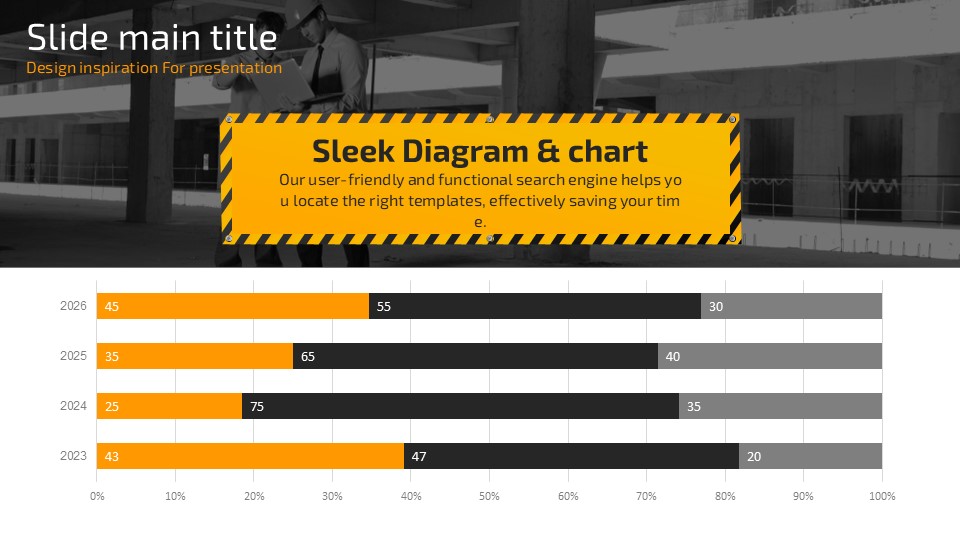
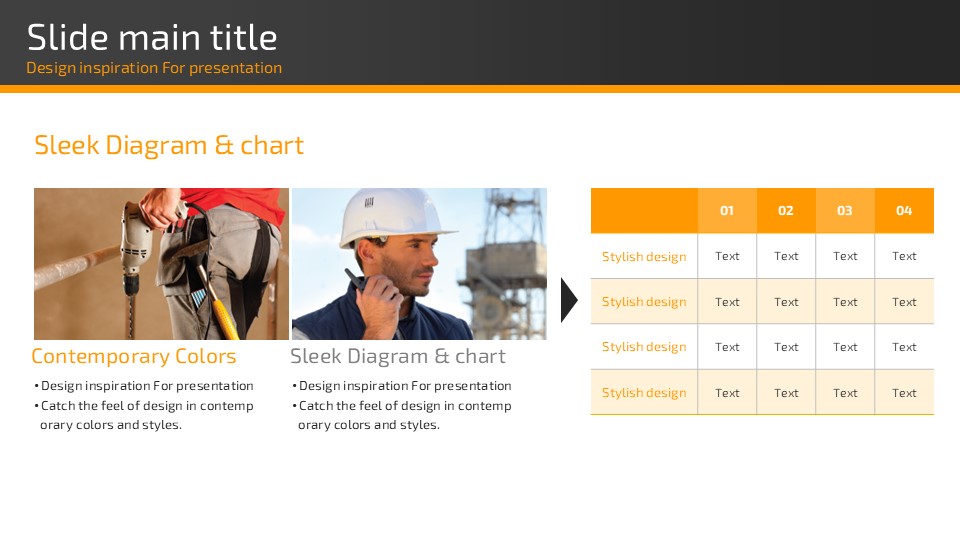
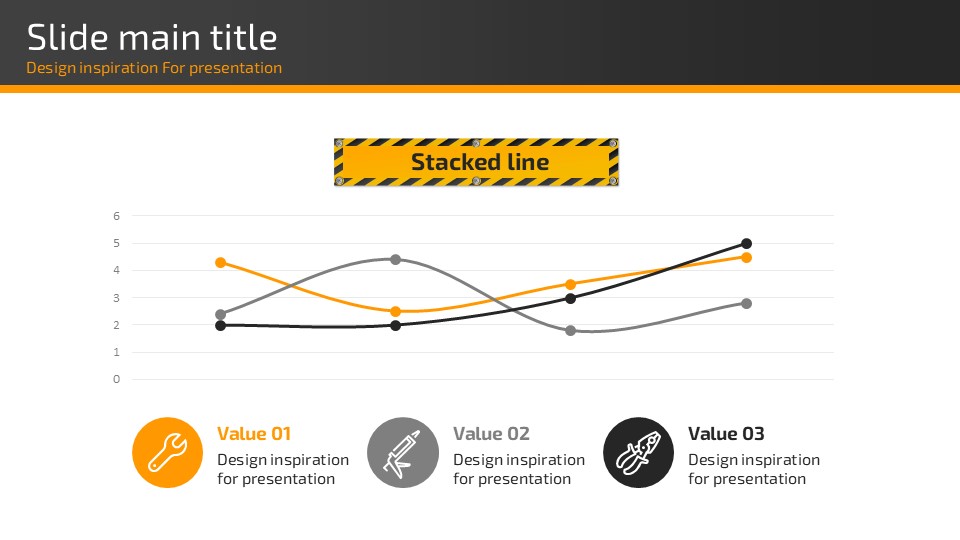
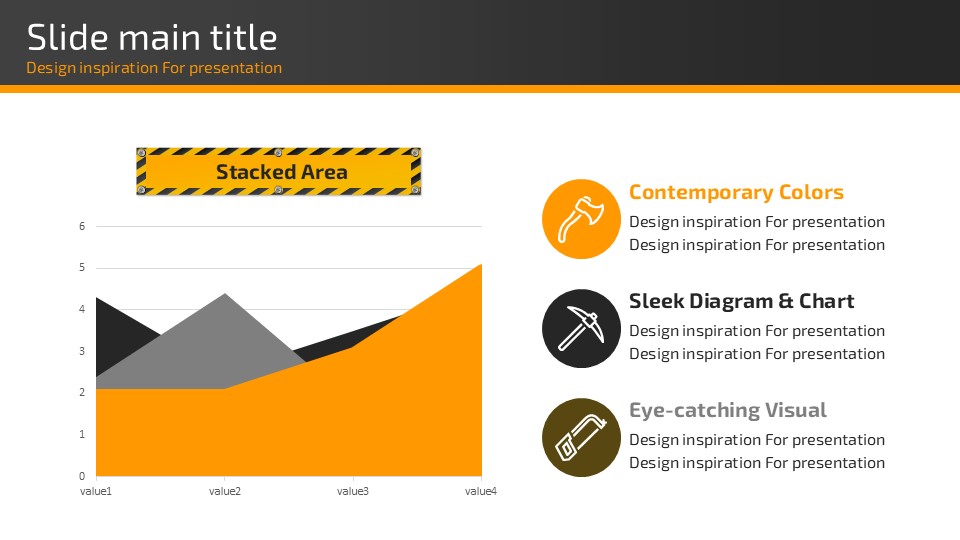
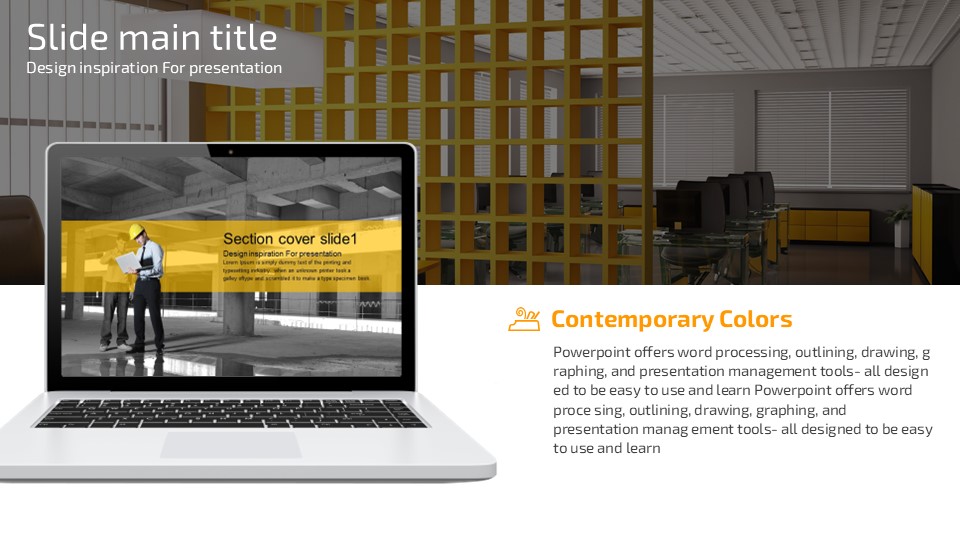
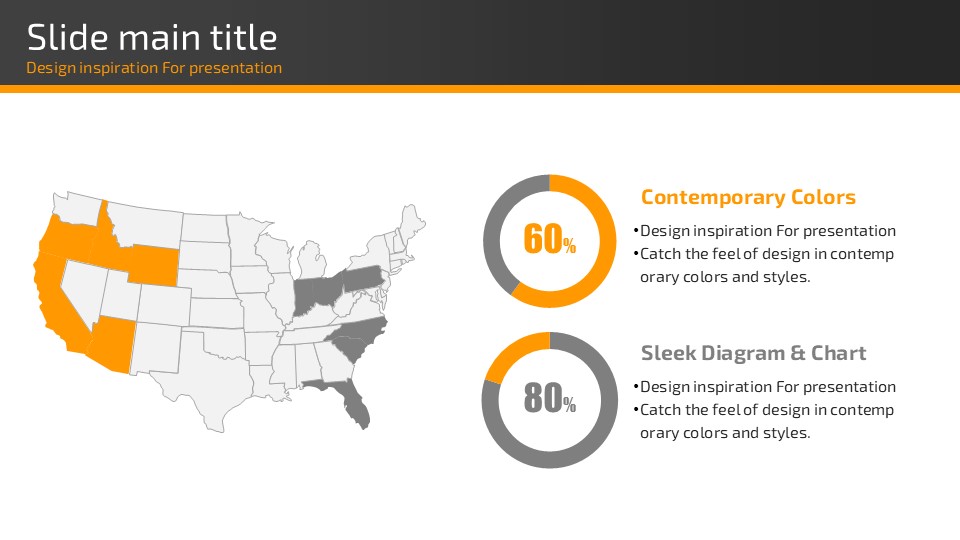
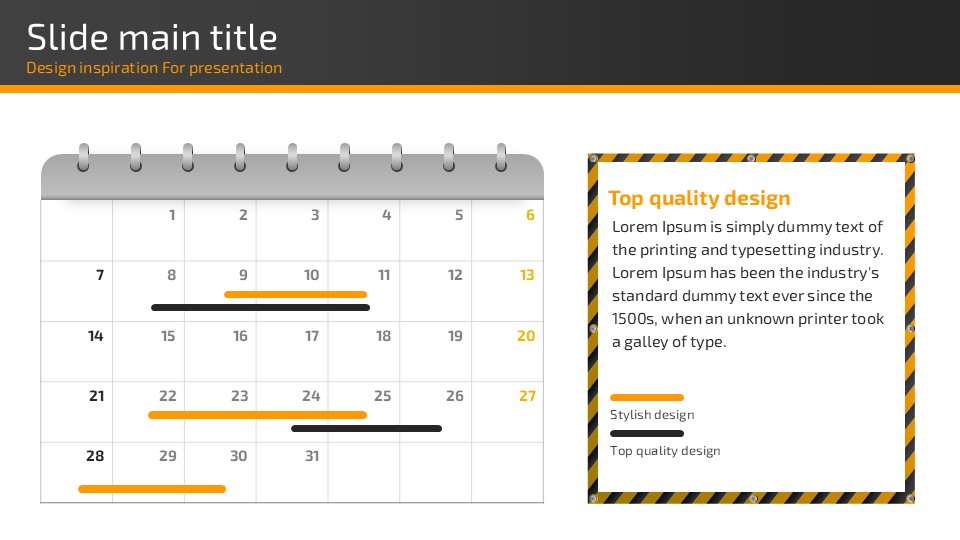
A professional PowerPoint template designed for the construction and real estate industry, featuring a bold orange and charcoal color scheme paired with high-impact job-site photography. This 30-slide presentation deck covers every section you need: cover slide, table of contents, data visualization slides with donut charts, four-quadrant icon diagrams, regional map slides, and dark-background two-column photo layouts. The consistent use of orange as an accent color against charcoal and white backgrounds creates a strong, authoritative visual identity throughout the entire slide deck. All elements—text, colors, charts, and images—are fully editable in PPTX format, making it easy to adapt for construction proposals, project progress reports, real estate development pitches, or infrastructure investment presentations. Whether you're presenting to clients, investors, or internal stakeholders, this template delivers a polished and credible look that reflects the scale and professionalism of your projects.
Usage Points
-
Main Usage
Designed for construction companies, real estate developers, and architecture firms to create polished presentations for project proposals, construction progress reports, site development pitches, and infrastructure investment briefings.
-
How to Use
Open the PPTX file and replace the cover title with your project name and company logo. Update the donut chart values with your actual progress data, swap in your regional project locations on the map slide, and replace placeholder photos with your own job-site images.
-
Recommended For
Construction project managers, real estate development teams, civil engineering firms, architecture studio planners, and executives preparing investor presentations or client-facing project proposals in the building and infrastructure sector.
-
Slide Structure
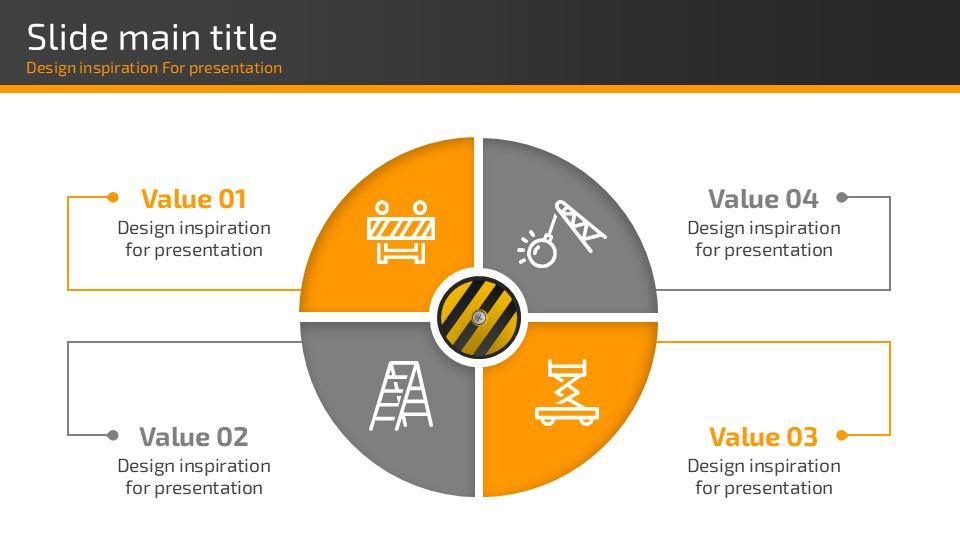
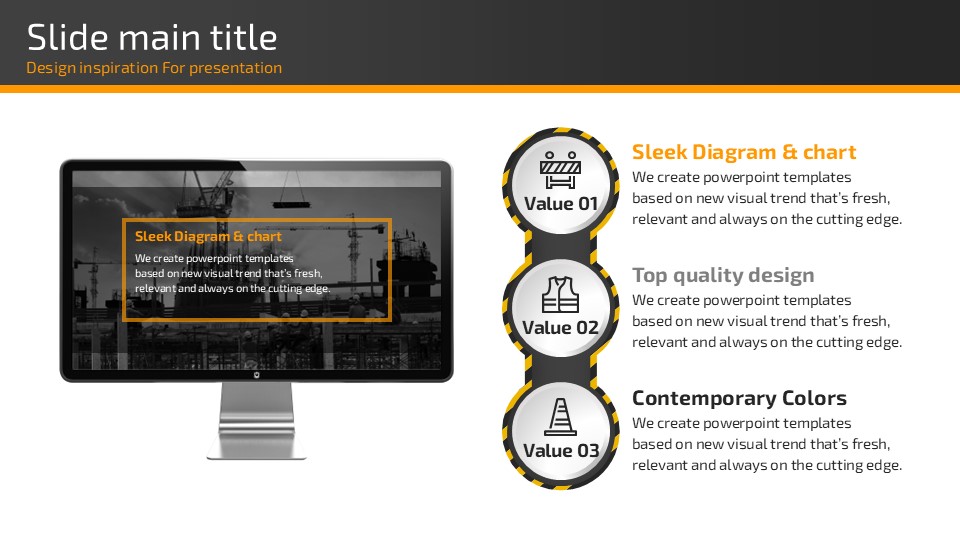
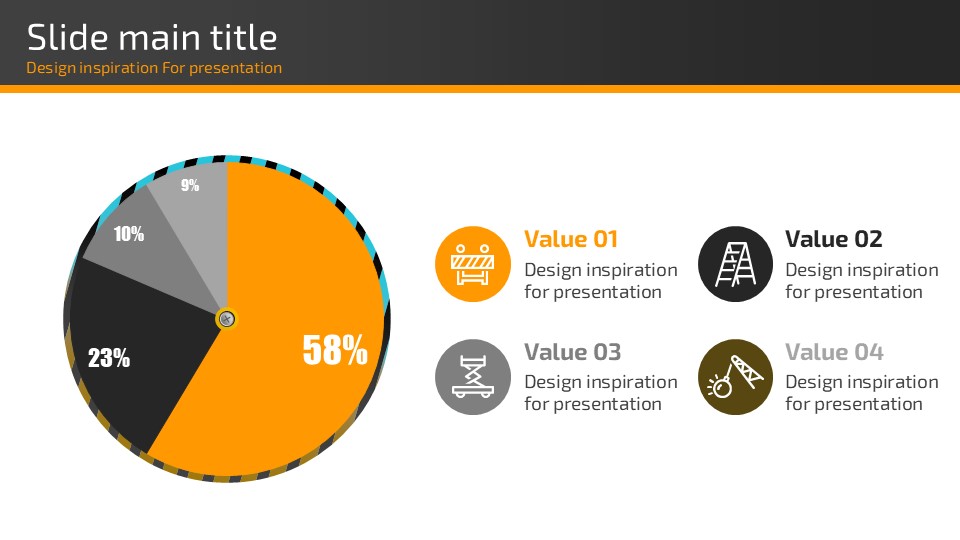
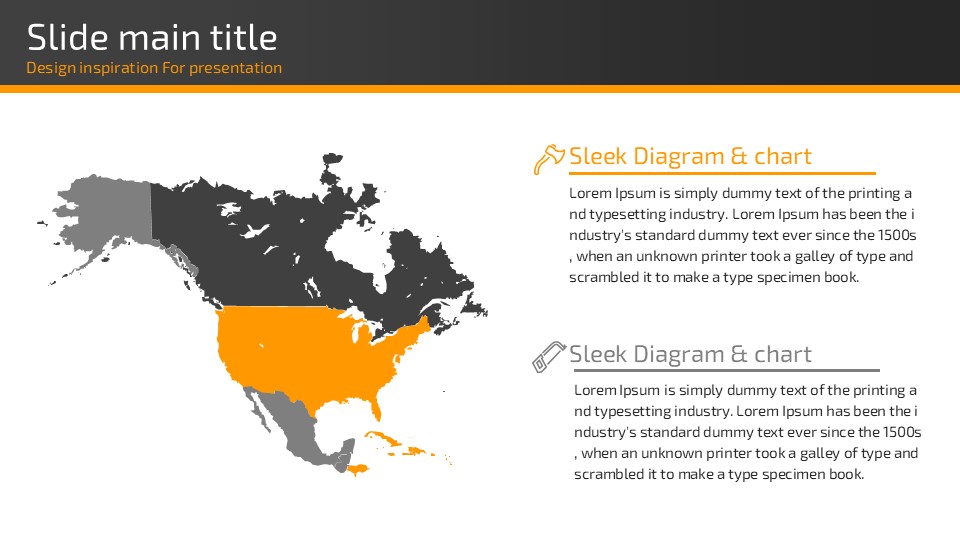
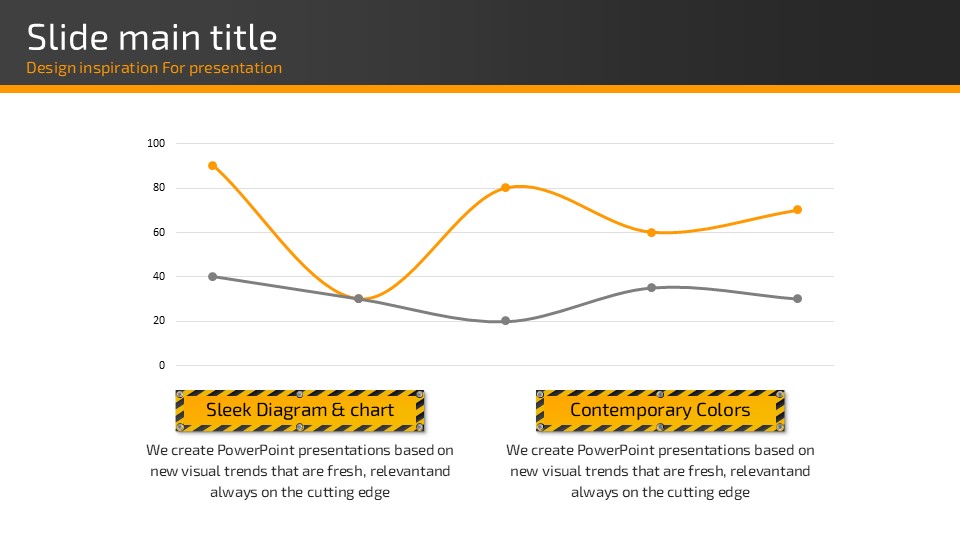
30 slides including: cover slide with full-bleed job-site photo and orange frame, 3-section table of contents, donut chart data slides (60/30/10 ratio layout), four-quadrant icon diagram, dark-background two-column photo slides, and a North America regional map slide with dual text panels.
Related Products
-

New Town Presentation Template – Modern Design and Professionalism
#Construction/Real Estate
-

Real Estate Presentation Template – Eye-Catching Design with Vibrant Colors
#Construction/Real Estate
-

House Construction PowerPoint Template – Modern and Professional Design
#Construction/Real Estate
-

Advanced Interior Presentation Template – Maximizing Visual Impact with Elegant Design
#Construction/Real Estate
