3 Market Share Analysis – Differentiated Market Strategy
RJ0900018_19
- Last Update 08/21/2025
- File Size 0.6MB
- # of Slides 2
- File Format PPTX
- Slide Ratio 16:9
- Color
Keywords
About the Product
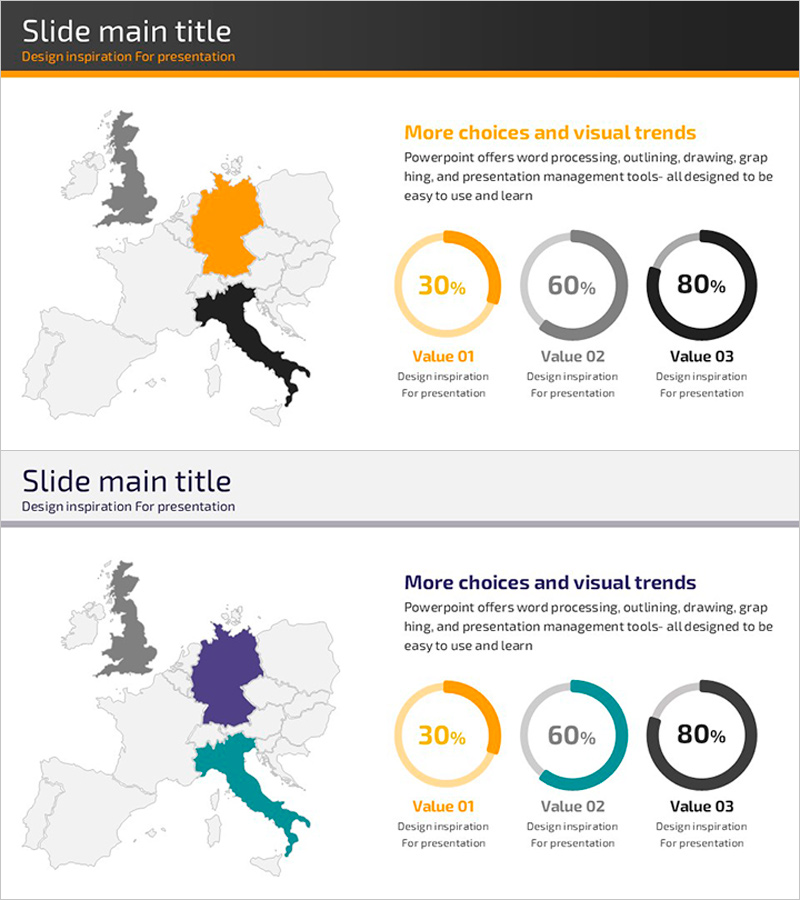
A PowerPoint slide template visualizing market share for three segments using donut-shaped pie charts. The donut graphs are color-coded in orange, gray, and black to distinguish each market segment and display their proportional values clearly. Combined with a European map showing regional market distribution, this layout is ideal for executive reports, marketing strategy presentations, and market analysis decks. The 2-slide set provides multiple color variations of donut charts, ready to edit and customize with your own data.
Usage Points
-
Main Usage
Visualize three-segment ratio data such as market share, sales distribution, or customer composition using donut-shaped pie charts. Effectively communicate the relative size of each segment in executive reports, marketing strategy presentations, and business analysis decks.
-
How to Use
Edit the donut chart values and colors to match your data. Customize the map region by adding or removing country labels for global or domestic market analysis. Add insights and analysis text to complete the presentation.
-
Recommended For
Executive and management reports / Market research presentations / Competitive analysis / Business performance analysis / Investment pitch decks / Quarterly and annual results reporting / Customer segmentation analysis
-
Slide Structure
2-slide set. Each slide features a European map (highlighting UK, Germany, Italy) positioned alongside 3-item donut charts (showing 30%, 60%, 80% sample values). First slide uses orange, gray, and black; second slide uses orange, teal, and black color schemes.
Related Products
-

Avocado Share Chart – Market Status and Competitive Analysis
#Market and Competitor Analysis #Graph #Other
-

Distribution Graph of Food Materials – Market Status Chart
#Market and Competitor Analysis #Graph #Other
-

Market Share and Usage Status by Application – Statistical Analysis
#Market and Competitor Analysis #Graph #Other
-

Doughnut Chart for Office Worker Commuting Survey Results – Market Trends Visualization
#Market and Competitor Analysis #Graph #Market Status
