Curved Graphs and Analysis Messages – Market and Competitor Analysis
RJ0900018_11
- Last Update 08/21/2025
- File Size 0.4MB
- # of Slides 2
- File Format PPTX
- Slide Ratio 16:9
- Color
Keywords
About the Product
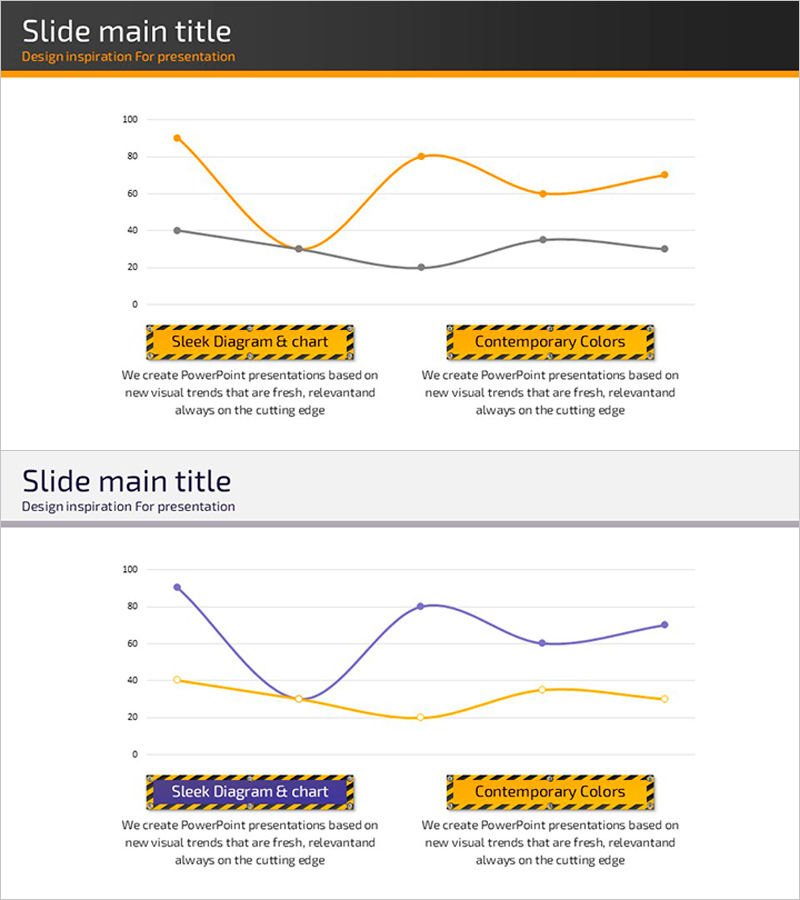
A dual-series line chart PowerPoint slide optimized for market analysis and competitor comparison. Orange and gray lines clearly represent two data streams, with Y-axis ranging from 0 to 100 and X-axis showing four time points to visualize change trends intuitively. Each slide features a title area at the top and a message box at the bottom, making it suitable for both presentations and reports. The 16:9 widescreen format with 2 slides is ready to edit and use immediately.
Usage Points
-
Main Usage
Express market size changes, competitor performance comparisons, and future forecasts by displaying two data series over time to emphasize relative trends. Effectively conveys key data in business reports, investment proposals, and marketing analysis presentations.
-
How to Use
Replace Y-axis values and X-axis time points with actual data, then input analysis content in the title and message box. Set the orange line as the primary indicator and gray line as the comparison target to help audiences immediately grasp the relationship between the two datasets.
-
Recommended For
Ideal for executive briefings, investor pitches, market analysis presentations, and competitive strategy meetings. Particularly effective when explaining correlations between two variables such as quarterly/annual performance comparisons, market share changes, and customer satisfaction trends.
-
Slide Structure
Both slides share identical layout: dark gray header at top (title area), dual-series line chart in center (2 series, 4 data points, grid lines included), yellow highlight box at bottom (message input area). 16:9 widescreen format optimized for projectors and online presentations.
Related Products
-

Curve Chart of Architectural Topics
#Market and Competitor Analysis #Graph #Competitor Analysis
-

Camping Isometric Future Market Outlook Line Graph
#Market and Competitor Analysis #Financial Plans and Performance #Graph
-

Rising Curve Graph for Sales Growth – Looking Ahead
#Market and Competitor Analysis #Financial Plans and Performance #Graph
-

Eco-friendly Business Project Line Graph – Embracing Sustainability
#Business Strategy #Market and Competitor Analysis #Graph
