Project Key Performance Charts – Highlighting Core Achievements
RJ0900018_5
- Last Update 08/21/2025
- File Size 4.2MB
- # of Slides 2
- File Format PPTX
- Slide Ratio 16:9
- Color
Keywords
About the Product
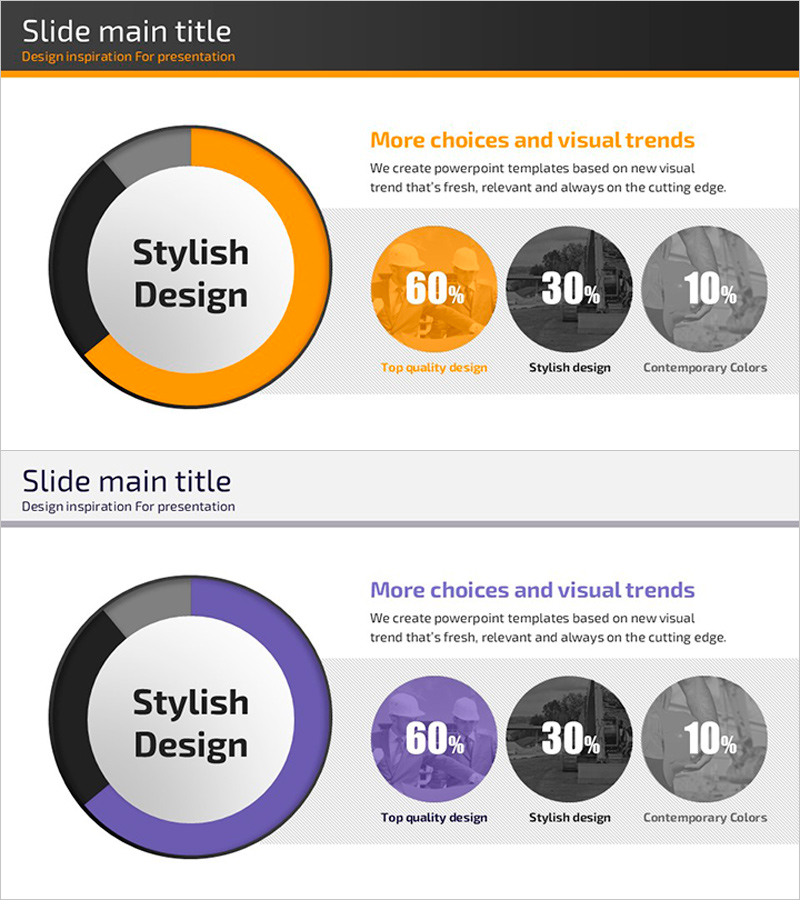
A 2-slide PowerPoint presentation set that visualizes project key performance metrics using donut charts. Available in two color versions—orange and purple—to emphasize core achievement indicators and display proportional relationships intuitively. Optimized for 16:9 widescreen format in fully editable PPTX, this slide deck enhances data-driven communication in performance presentations, business reports, and project evaluations. The donut chart design captures audience attention and delivers performance messages with clarity and visual impact.
Usage Points
-
Main Usage
Designed to analyze and visually emphasize project performance across three key metrics using proportional representation. The donut chart's center space accommodates core messages or numerical highlights, making it ideal for performance presentations, business evaluations, and investor reports requiring data-backed communication.
-
How to Use
Slide 1 features an orange-toned donut chart; Slide 2 uses a purple tone. Double-click the chart data to input values and category labels—proportions update automatically. Add key performance messages in the center text area to amplify emphasis and narrative impact.
-
Recommended For
Project managers, business analysts, and marketing teams presenting performance results to executives, clients, and stakeholders. Suitable for quarterly performance reviews, project completion reports, and business outcome analysis presentations where data credibility is essential.
-
Slide Structure
2-slide layout. Each slide positions a 3-segment donut chart centrally with a text area on the right. Color schemes differentiate: orange, black, and gray (Slide 1) versus purple, black, and gray (Slide 2), allowing flexible tone adjustment based on presentation context.
Related Products
-

Identity Presentation Wide Company Overview – Rich Information Delivery
#Company Introduction #Graph #Company Overview
-

Performance Achievement Status Illustrated with Doughnut Chart Slide
#Company Introduction #Market and Competitor Analysis #Graph
-

Achievement Performance and Goal Analysis Chart – Visualizing Performance
#Company Introduction #Market and Competitor Analysis #Graph
-

Trend Color Donut Chart Slide Template – Market and Competitive Analysis
#Company Introduction #Market and Competitor Analysis #Graph
