Demand Charts in Region – A Convincing Tool for Market Analysis
RJ0900018_28
- Last Update 08/21/2025
- File Size 0.5MB
- # of Slides 2
- File Format PPTX
- Slide Ratio 16:9
- Color
Keywords
- #Content-Based Slides
- #Design-Based Slides
- #Market and Competitor Analysis
- #Graph
- #Other
- #Market Status
- #Target Market
- #Circles
- #Doughnut Chart
- #16:9
- #donut chart PowerPoint slide
- #pie chart template download
- #regional demand visualization
- #market analysis presentation
- #data visualization slide design
About the Product
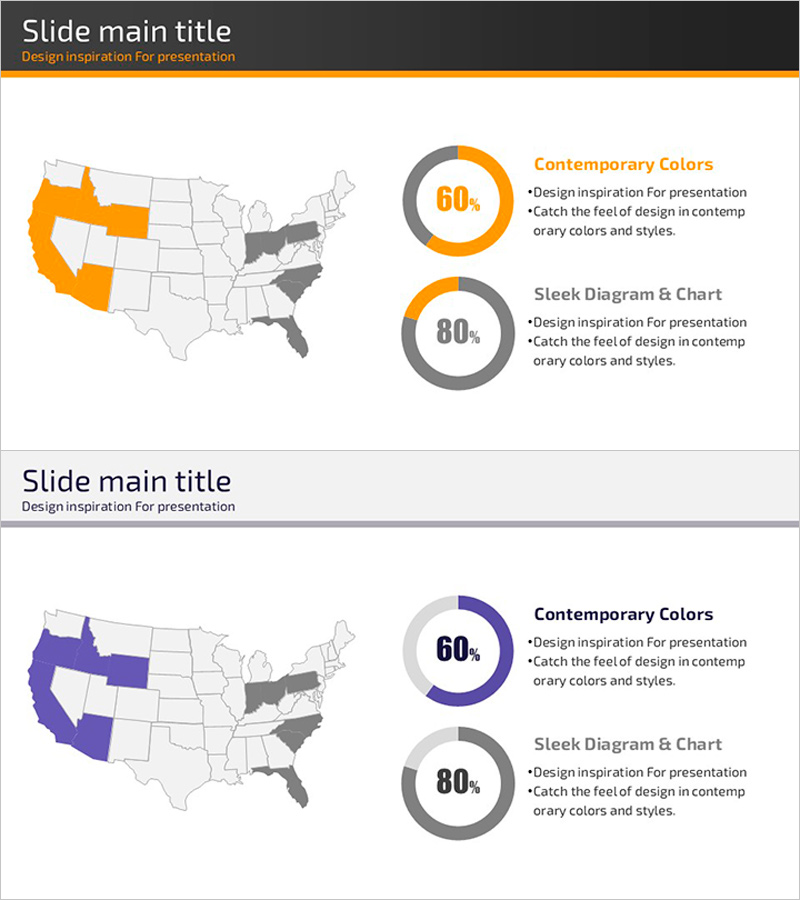
A professional donut chart PowerPoint slide designed to visualize regional demand data with clarity and impact. Featuring a dual-tone color scheme of orange and gray, this slide combines a world map with donut charts to effectively communicate market analysis across regions. The 2-slide deck in 16:9 widescreen format is fully editable in PPTX, making it ideal for executive presentations, sales reports, and marketing strategy discussions. Perfect for conveying market share, regional performance, and demand distribution in a data-driven manner.
Usage Points
-
Main Usage
Visualize regional and segment-based demand ratios using donut charts to communicate market analysis data clearly. Serves as a critical slide for executive briefings, marketing strategy presentations, and sales performance analysis to support data-driven decision-making.
-
How to Use
The first slide displays a world map with highlighted regions alongside donut charts showing demand percentages for those regions. The second slide uses alternate colors (gray and blue) for comparative analysis. Simply edit the text and numerical values to reflect your actual data, and the visual structure remains intact.
-
Recommended For
Marketing managers, sales directors, executives, consultants, and market research professionals presenting regional demand insights. Ideal for quarterly performance reviews, new market entry strategies, and regional sales performance presentations.
-
Slide Structure
2-slide layout featuring world map with regional highlights, dual donut charts per slide (displaying 60% and 80% data ratios), and accompanying legend text. Color palette includes orange, gray, and blue for data series differentiation. 16:9 widescreen format with full PPTX editability.
Related Products
-

Global Target Market Analysis Map – Utilizing Visual Data
#Company Introduction #Market and Competitor Analysis #Graph
-

3 Market Share Analysis – Differentiated Market Strategy
#Market and Competitor Analysis #Graph #Other
-

Donut Chart Visualizing Progress of Space Industry by Country
#Company Introduction #Market and Competitor Analysis #Graph
-

Analysis of Target Market Construction Status – Data Visualization Tool
#Market and Competitor Analysis #Graph #Other
