Technology Outlook Graph - Market Status and Future Projections
RJ0900018_26
- Last Update 08/21/2025
- File Size 0.4MB
- # of Slides 2
- File Format PPTX
- Slide Ratio 16:9
- Color
Keywords
- #Content-Based Slides
- #Design-Based Slides
- #Market and Competitor Analysis
- #Graph
- #Other
- #Market Status
- #Future Outlook
- #16:9
- #stacked area chart PowerPoint slide
- #cumulative area graph presentation
- #multi-data visualization slide
- #market analysis chart PPT
- #how to create stacked area chart in PowerPoint
About the Product
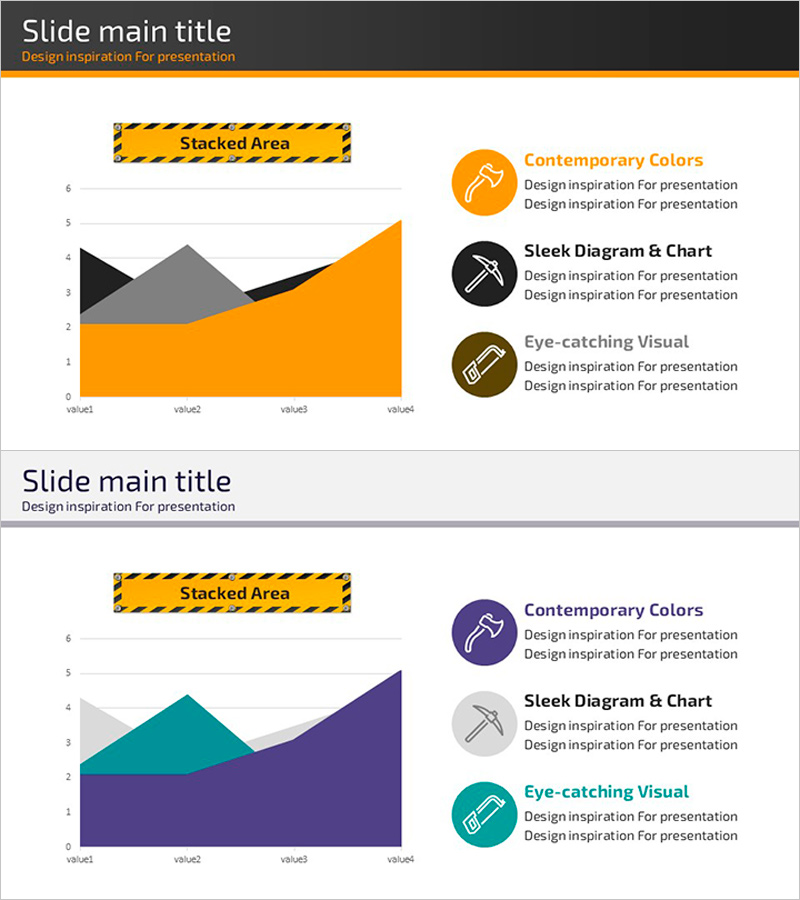
A stacked area chart PowerPoint slide designed to visualize technology outlook and market status. The cumulative area chart features four layers in orange, black, gray, and navy blue, effectively displaying how multiple data sets change over time. The right side includes a legend area with three feature descriptions—contemporary colors, sleek diagrams and charts, and eye-catching visuals—each paired with an icon. This slide is ideal for presentations, business plans, and analytical reports where you need to communicate complex data such as competitive comparisons, market share evolution, and technology trends. Formatted in 16:9 widescreen, 2-slide set, fully editable PPTX.
Usage Points
-
Main Usage
Visualizes time-series multi-data changes such as technology trends, market conditions, and competitor market share using a stacked area chart. Transforms complex numerical data into an intuitive visual format, making it ideal for investor presentations, business reports, and market analysis discussions.
-
How to Use
Input actual data into the chart area on the left side of the slide, and the four cumulative layers will automatically update. Modify the legend text on the right to describe each data layer's meaning. During presentations, use the slide to highlight temporal trends or analyze shifts in each layer's proportion.
-
Recommended For
Recommended for technology planning teams, marketing departments, executive presentations, investor IR materials, business performance reports, and market analysis documents. Particularly effective when demonstrating how multiple variables change over time in strategic planning and decision-support materials.
-
Slide Structure
The slide is divided into three sections: title area (top dark gray background), chart area (left side with 4-layer stacked area graph), and legend area (right side with 3 feature items including icons and text fields). The chart distinguishes four data layers by color, while the legend provides editable text fields for feature descriptions.
Related Products
-

Industry Trends and Market Growth Analysis Chart
#Market and Competitor Analysis #Diagram #Graph
-

Industry Growth Rate and Trend Analysis Chart – Market Prospect
#Market and Competitor Analysis #Graph #Other
-

Hybrid Graph for Competitor Analysis – Visualizing Market Trends
#Market and Competitor Analysis #Graph #Other
-

Employment Gender Ratio Analysis Slide
#Market and Competitor Analysis #Graph #Other
