Construction Process Diagram – Operational Plan and Technical Development Strategy
RJ0900018_14
- Last Update 08/21/2025
- File Size 1.8MB
- # of Slides 2
- File Format PPTX
- Slide Ratio 16:9
- Color
Keywords
- #Content-Based Slides
- #Design-Based Slides
- #Operational Plan
- #Diagram
- #Production and Technology Development Strategy
- #Business Processes
- #Cluster
- #Chain Diagram
- #16:9
- #connected diagram PowerPoint
- #8-step process slide
- #workflow diagram template
- #construction project PowerPoint
- #operational planning slide template
About the Product
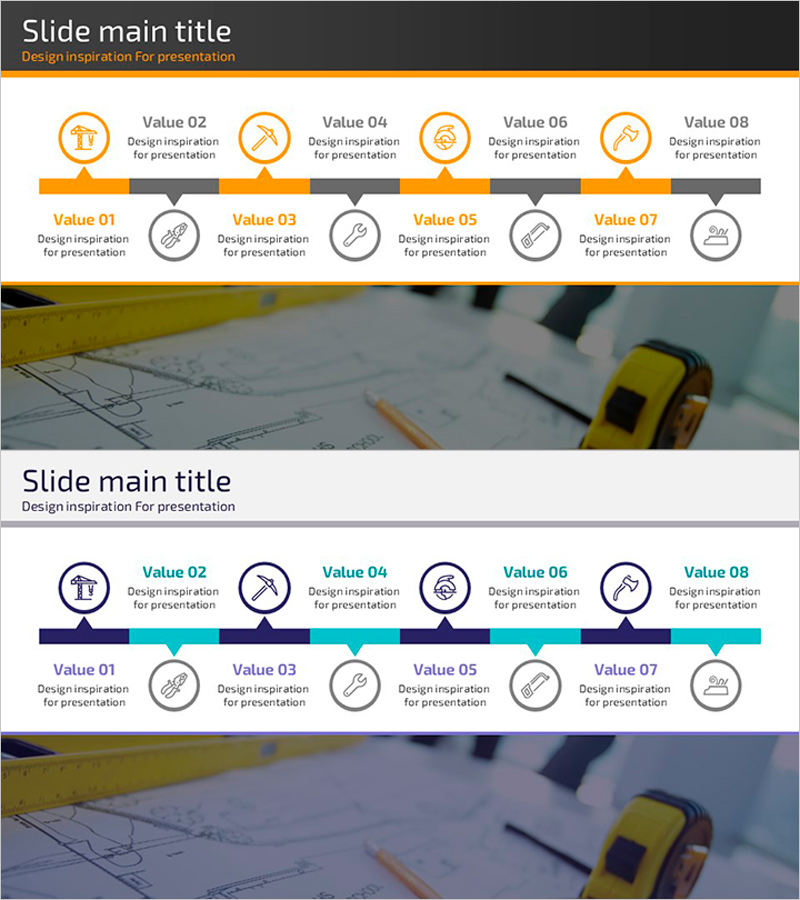
An 8-step connected diagram PowerPoint slide designed to visualize operational planning and technical development strategy for construction projects. The two-tone color scheme of orange and gray distinguishes upper and lower process stages, with icons and text labels at each node to clearly represent workflow progression. Available in 16:9 widescreen format with 2 fully editable slides, this presentation template is ideal for explaining operational processes across construction, manufacturing, IT, and other industries.
Usage Points
-
Main Usage
Visually communicate the sequential operational planning and technical development strategy of construction projects through a structured 8-node diagram. The linear connection flow clearly illustrates each stage's role and interdependencies, enabling stakeholders to understand the complete process at a glance.
-
How to Use
Customize node text and icons to match your project phases. Use the orange nodes for primary stages and gray nodes for supporting stages to create a hierarchical information structure. The arrow connectors emphasize linear progression and can be adapted for construction, manufacturing, IT, consulting, and other industry-specific process flows.
-
Recommended For
Project managers, operations planners, and technical leads in construction, engineering, and manufacturing sectors. Also suitable for IT professionals, consultants, and strategy teams presenting system architecture, implementation roadmaps, or multi-phase business initiatives to stakeholders and decision-makers.
-
Slide Structure
2-slide set featuring an 8-node connected diagram with orange and gray dual-tone styling. First slide displays the interactive diagram with circular icons and text labels; second slide provides a background image version. Each node is connected by directional arrows showing sequential workflow progression.
Related Products
-

Unfolding Business Strategy Across the City – Cluster Diagram
#Business Vision and Strategy #Operational Plan #Diagram
-

Step-by-Step Work Process Connection Diagram – Clear Visualization for Business Strategy
#Business Strategy #Operational Plan #Diagram
-

Traffic Accident Connection Diagram - Effective Business Process Development
#Business Strategy #Operational Plan #Diagram
-

Step-by-Step Emphasis Process Slide - Operational Planning and Innovation Facilitation
#Operational Plan #Technical Approach #Diagram
