Facility Management Plan Chart – Optimizing Operations and Investments
RJ0900018_18
- Last Update 08/21/2025
- File Size 1.8MB
- # of Slides 2
- File Format PPTX
- Slide Ratio 16:9
- Color
Keywords
- #Content-Based Slides
- #Design-Based Slides
- #Operational Plan
- #Diagram
- #Capital Investment Plan
- #Post-Implementation Management & Maintenance
- #Table
- #Standard Table
- #16:9
- #facility management table PowerPoint
- #operations plan slide template
- #facility investment chart
- #comparison table PPT
- #facility management presentation slide
- #how to create facility plan in PowerPoint
About the Product
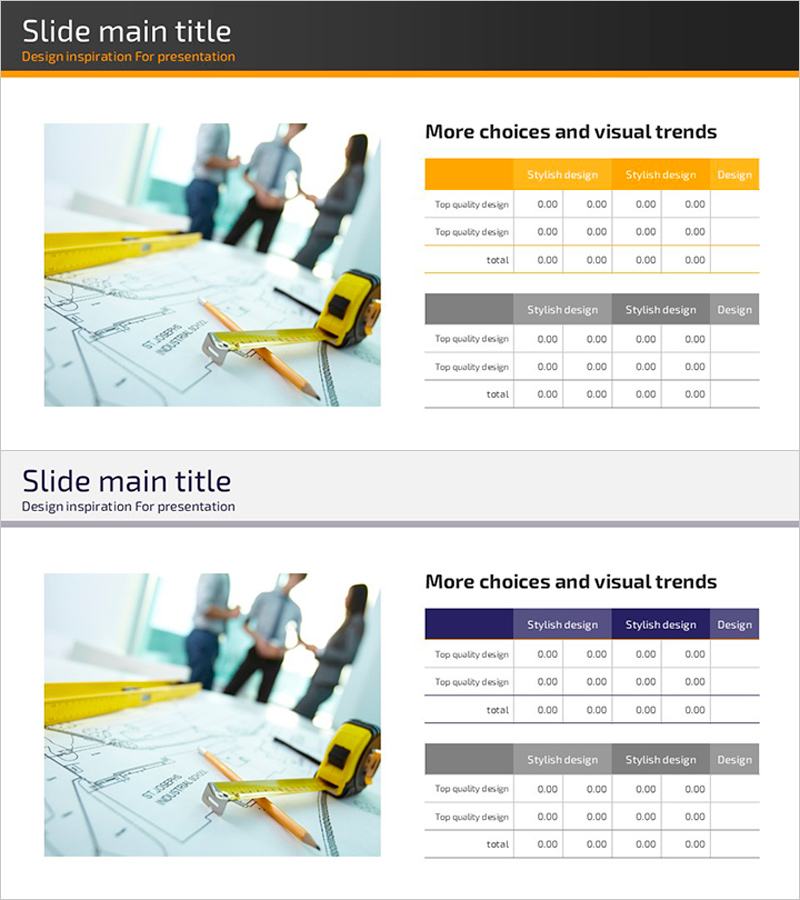
A table-format PowerPoint slide for visualizing facility management and operational planning. The 2-slide set features an orange header and gray divider lines organized in a 4-column layout, enabling you to compare facility investment plans, operational optimization, quality management, and other key metrics. Each row accommodates numerical data and text, making it ideal for facility management reports, operational plans, and investment proposals to clearly communicate cost-benefit analysis, priority ranking, and scheduling. Delivered in 16:9 PPTX format, fully editable and ready to customize.
Usage Points
-
Main Usage
Visualize facility management plans, operational optimization strategies, and investment prioritization using a table format to enhance stakeholder understanding. Compare multiple facility attributes—cost, impact, timeline, responsibility—in a matrix structure to support transparent decision-making.
-
How to Use
Insert into facility management reports, operational plans, or investment proposals in the 'Current Status' or 'Implementation Plan' section. Enter facility names, costs, benefits, and timelines in each row; add rows as needed to expand comparison items. Maintain the orange header as a visual anchor for consistency across your presentation.
-
Recommended For
Facility managers, operations directors, capital investment executives, and teams in construction, manufacturing, energy, and real estate management. Ideal for organizations conducting facility audits, maintenance planning, and capital expenditure decision-making.
-
Slide Structure
2-slide set, each featuring an orange header row with 4 columns (e.g., Item, Cost, Benefit, Timeline) and gray divider lines. Slide 1 focuses on facility investment planning; Slide 2 on operational optimization. Each row includes input areas for numerical data and text entries.
Related Products
-

Blue Orange Checklist – Diagram for Operational Planning
#Operational Plan #Diagram #Capital Investment Plan
-

Effort and Performance Table Chart – Optimizing Operational Planning
#Operational Plan #Diagram #Capital Investment Plan
-

Process Timeline and Resource Table – Optimizing Operational Plans
#Operational Plan #Diagram #Capital Investment Plan
-

Simple PPT Wide Template Image&Text2 – Optimizing Operational Plans and Capital Investments
#Operational Plan #Capital Investment Plan #Post-Implementation Management & Maintenance
