Graphic Analysis of Safety Accidents – Market Insights and Trends
RJ0900018_23
- Last Update 08/21/2025
- File Size 1.4MB
- # of Slides 2
- File Format PPTX
- Slide Ratio 16:9
- Color
Keywords
- #Content-Based Slides
- #Design-Based Slides
- #Business Introduction
- #Market and Competitor Analysis
- #Graph
- #Industry Trends
- #Horizontal Bar
- #Segmented Horizontal Bar
- #16:9
- #horizontal bar chart PowerPoint
- #safety accident analysis slides
- #year-over-year comparison template
- #data visualization presentation
- #bar graph PPT slide
- #business analytics template
About the Product
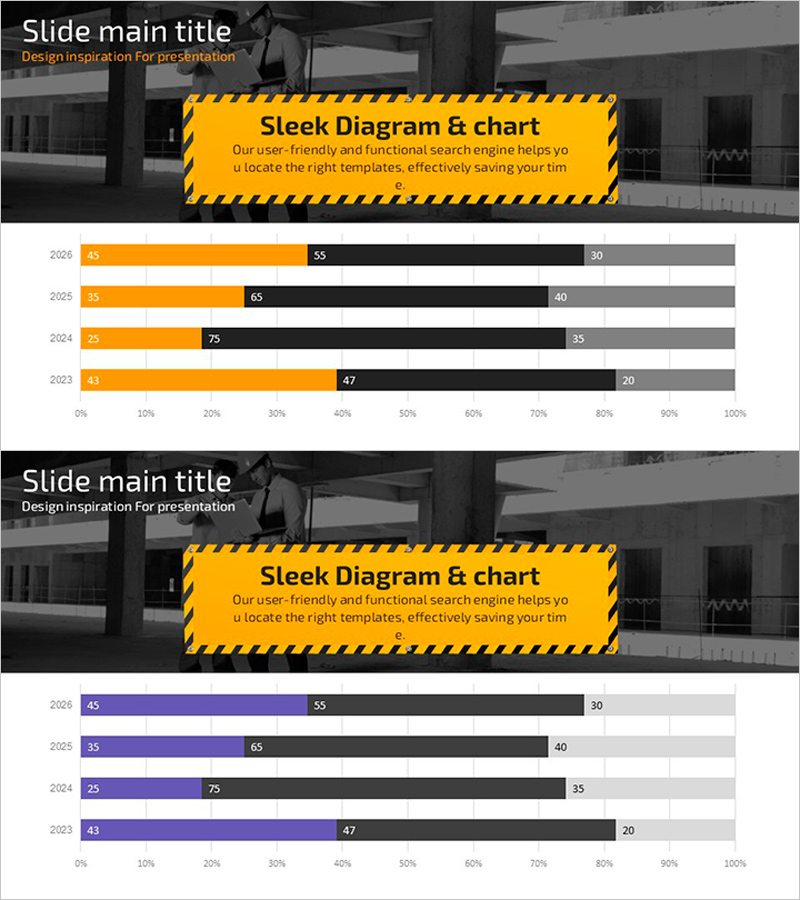
A PowerPoint slide visualizing safety accident trends from 2023 to 2026 using horizontal bar charts. The slide features three data series in orange, black, and gray bars, enabling effective year-over-year comparison and trend analysis. Ideal for market analysis presentations, data-driven insights, and performance reports. The 2-slide set is flexible and ready to integrate into various business presentation contexts.
Usage Points
-
Main Usage
Quantitatively compare and analyze safety accident trends across years, and derive market insights. Horizontal bar charts allow multiple data points to be compared at a glance, making them ideal for executive briefings, safety management meetings, and performance analysis presentations.
-
How to Use
Edit the displayed numbers with your actual data for immediate use. Adjust bar lengths and colors to match your organization's safety statistics, creating a credible, data-driven presentation that resonates with stakeholders.
-
Recommended For
Safety managers, executives, quality assurance specialists, HR departments, and industrial safety consultants. Suitable for regular safety briefings, executive meetings, stakeholder presentations, and annual performance reviews.
-
Slide Structure
Two-slide set with 4-year data (2023–2026) represented by three horizontal bar series in orange, black, and gray. Clear horizontal axis scaling (0–100%) and year labels ensure readability. Yellow warning banner and dark background add visual emphasis.
Related Products
-

Cumulative Results Over Four Years – Market Trends and Strategy
#Business Introduction #Market and Competitor Analysis #Graph
-

Yearly Breakdown of Sales Trends – Visualizing Market Dynamics
#Business Introduction #Market and Competitor Analysis #Graph
-

Blue Green Stacked Bar Chart – Market Trend Analysis
#Business Introduction #Market and Competitor Analysis #Graph
-

Market Research and Trend Segmentation Chart – Effective Market Analysis
#Business Introduction #Market and Competitor Analysis #Graph
