Trends by Technology Graph – Market and Competitor Analysis
RJ0900018_20
- Last Update 08/21/2025
- File Size 0.4MB
- # of Slides 2
- File Format PPTX
- Slide Ratio 16:9
- Color
Keywords
- #Content-Based Slides
- #Design-Based Slides
- #Market and Competitor Analysis
- #Graph
- #Industry Trends
- #Column
- #Segmented Column
- #16:9
- #technology trends chart
- #horizontal bar graph PowerPoint
- #vertical bar chart presentation
- #stacked bar graph slide
- #market analysis template
- #competitor analysis PowerPoint
About the Product
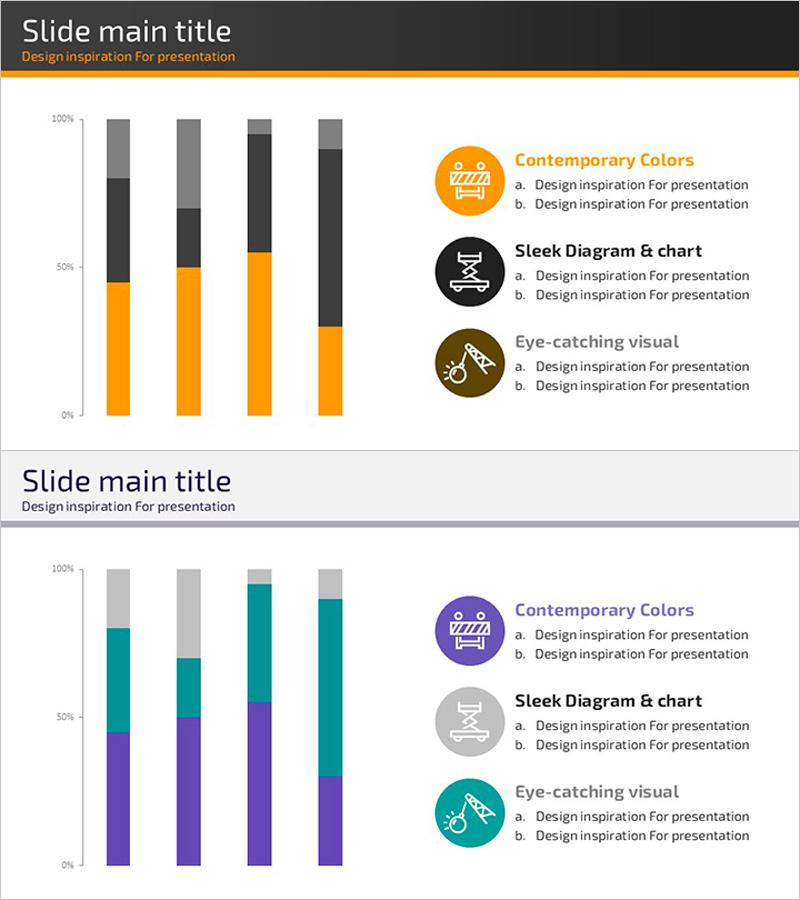
A 2-slide PowerPoint presentation for visualizing technology market trends. The first slide features a horizontal stacked bar chart with orange, black, and gray segments representing 4 technology items and their proportional changes. The second slide displays the same data using a vertical stacked bar chart in purple, teal, and gray to analyze from a different perspective. Each slide includes a legend with 3 circular icons (orange, black, brown) to clearly distinguish data series. Provided in 16:9 widescreen PPTX format, ready for immediate use in competitive analysis, market research, and technology trend presentations.
Usage Points
-
Main Usage
Analyzes and compares technology market share, growth rates, and competitive intensity from multiple angles. Horizontal bars intuitively show proportional composition by item, while vertical bars emphasize change trends over time or across categories. The stacked structure simultaneously conveys overall scale and partial proportions.
-
How to Use
Use in technology trend analysis, market research, and competitor benchmarking presentations as a data comparison section. Replace each bar segment color with actual values and update legend text with technology names. Positioning both slides consecutively enables storytelling that interprets the same data from different perspectives.
-
Recommended For
Ideal for quarterly and annual reports by executives, marketing teams, strategy planners, and R&D departments. Effective for technology companies, IT consulting firms, and market research institutions to enhance data credibility in investor presentations and strategic briefings.
-
Slide Structure
Slide 1: 4 horizontal stacked bars (orange, black, gray) + 3 circular legend icons on right / Slide 2: 4 vertical stacked bars (purple, teal, gray) + 3 circular legend icons on right. Title area at top and subtitle area at bottom on each slide.
Related Products
-

Graph of Changes After a Healthy Diet – Data Visualization Template
#Market and Competitor Analysis #Graph #Market Analysis
-

Housing Construction Business Trend Graph – Market Analysis Opportunities
#Market and Competitor Analysis #Graph #Industry Trends
-

Natural Vertical Bar Segment Chart – A Key Tool for Market Analysis
#Business Strategy #Market and Competitor Analysis #Graph
-

Four-Year Industrial Market Trends – Market Analysis and Decisions
#Market and Competitor Analysis #Financial Plans and Performance #Graph
