Diagram Slide Visualizing Technology Utilization System
RJ0900018_15
- Last Update 08/21/2025
- File Size 0.4MB
- # of Slides 2
- File Format PPTX
- Slide Ratio 16:9
- Color
Keywords
- #Content-Based Slides
- #Design-Based Slides
- #Business Introduction
- #Business Strategy
- #Diagram
- #Technological Status
- #Production Plan
- #Cluster
- #Spread
- #Chain Diagram
- #Centralized Diagram
- #16:9
- #radial diagram PowerPoint
- #central diagram slide template
- #technology utilization slide
- #business strategy diagram
- #6-item radial diagram PowerPoint template
About the Product
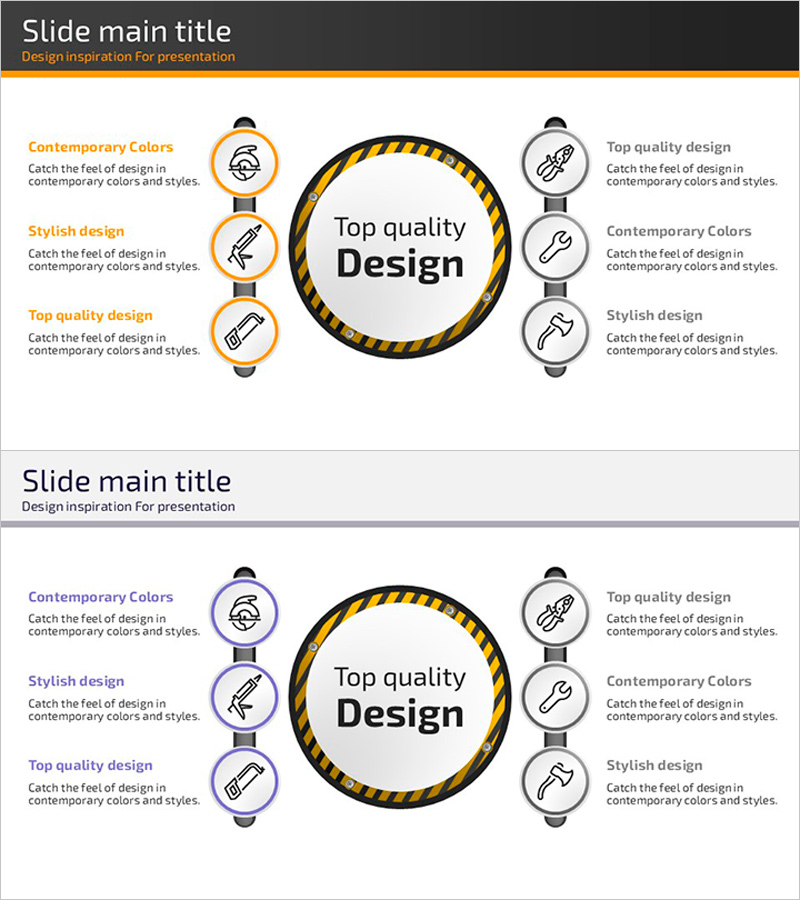
A PowerPoint slide that visualizes a technology utilization system using a central radial diagram structure. Six items radiate outward from the core concept at the center, making it ideal for expressing technology strategy, business processes, and organizational roles in a hierarchical manner. The two-tone color scheme featuring an orange accent circle and gray icons clearly conveys information hierarchy. With 2 slides included, this template is ready to apply to various presentation scenarios, and the text and icon areas provide ample space for customization.
Usage Points
-
Main Usage
Visualizes information structures where concepts radiate outward from a central core, such as technology strategies, business processes, and organizational roles. The relationship between the central concept and surrounding items is instantly clear, making it effective for strategy presentations, technical explanations, and organizational structure introductions.
-
How to Use
Enter the core concept (technology name, strategy name, or organization name) in the central circle, then add detailed content to the six radial items. Customize icon and text colors to match your organization's branding for use in executive reports, investor presentations, and team meetings.
-
Recommended For
Technology managers, strategy planning teams, executives, consultants, and educators. Recommended for presentations on technology roadmaps, business strategies, organizational roles, process improvements, and market analysis.
-
Slide Structure
2-slide set. The first slide features an orange accent circle with six gray icons arranged radially. The second slide uses the same layout with alternative colors (orange to purple tones) to support diverse topic presentations. Each item includes ample text input space and icons are replaceable.
Related Products
-

Green Orange Highlight Connection Diagram
#Business Strategy #Diagram #Production Plan
-

Diagram of Herbal Medicine Ingredients – Business Promotion Strategy and Core Competencies
#Business Vision and Strategy #Business Strategy #Diagram
-

Sports Infographic Strategy Diagram – Vision and Competitiveness
#Business Introduction #Business Vision and Strategy #Diagram
-

Key Chemical Composition Charts for Effective Data Visualization
#Business Introduction #Diagram #Business Areas
