Data Analysis Presentation Template Wide – Stylish Information Delivery
J0400063
- Last Update 08/29/2025
- File Size 25.9MB
- # of Slides 30
- File Format PPTX
- Slide Ratio 16:9
- Color
Slide Preview


Keywords
About the Product
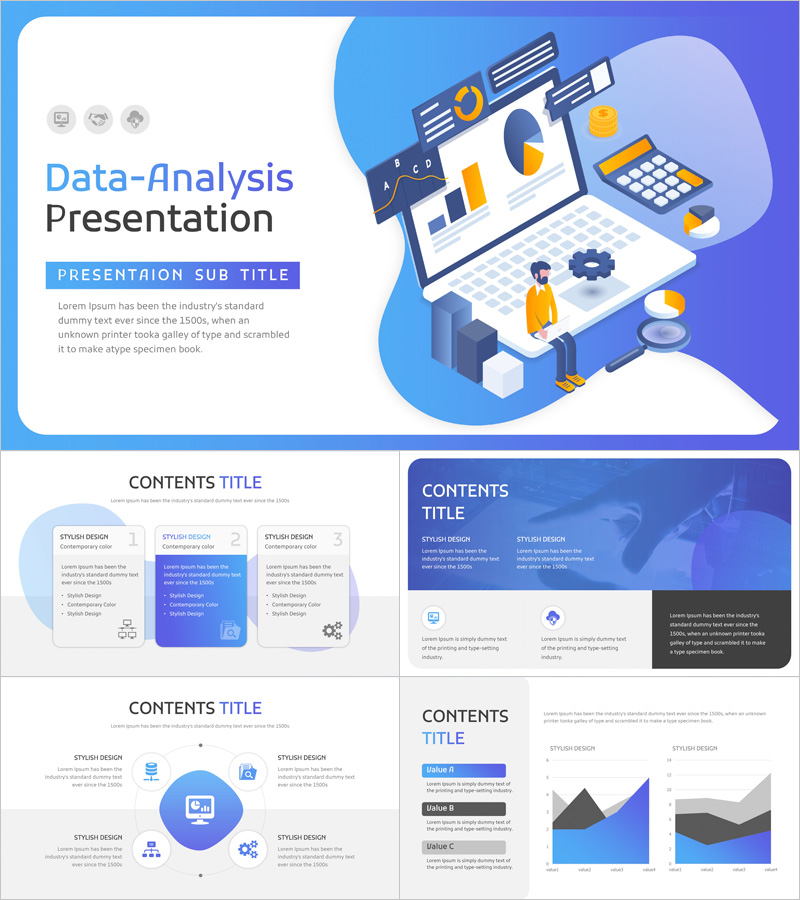
A professional PowerPoint template designed for data analysis and IT presentations, featuring a blue-to-purple gradient palette combined with isometric 3D illustrations of dashboards, laptops, and charts. This 30-slide PPT set covers everything from a bold cover slide to data visualization layouts, making it ideal for tech companies, data analysts, and IT service providers. The template includes a variety of slide types: three-column card layouts, dark-blue two-panel comparison slides, icon grid slides with monitor imagery, two-column text-and-photo layouts, and line graph or area chart slides for clear data storytelling. All slides are fully editable in PPTX format, allowing you to customize text, colors, and images to match your brand. Whether you are presenting quarterly data reports, pitching a new tech service, or reviewing analytics with your team, this presentation deck delivers a polished, technical look that builds credibility with your audience.
Usage Points
-
Main Usage
Designed for IT and tech professionals who need to present data analysis results, service overviews, or technical reports. The blue gradient isometric design communicates technical expertise and builds audience confidence in data-driven presentations.
-
How to Use
Download the PPTX file and open it directly in PowerPoint or Keynote. Replace placeholder text, images, and chart data with your own content. Select only the slide layouts you need from the 30-slide set to build a focused, professional presentation deck.
-
Recommended For
Best suited for data analysts, IT planners, and tech marketers at startups or established tech companies. Ideal for investor data briefings, internal analytics reviews, client service pitches, and team performance reports.
-
Slide Structure
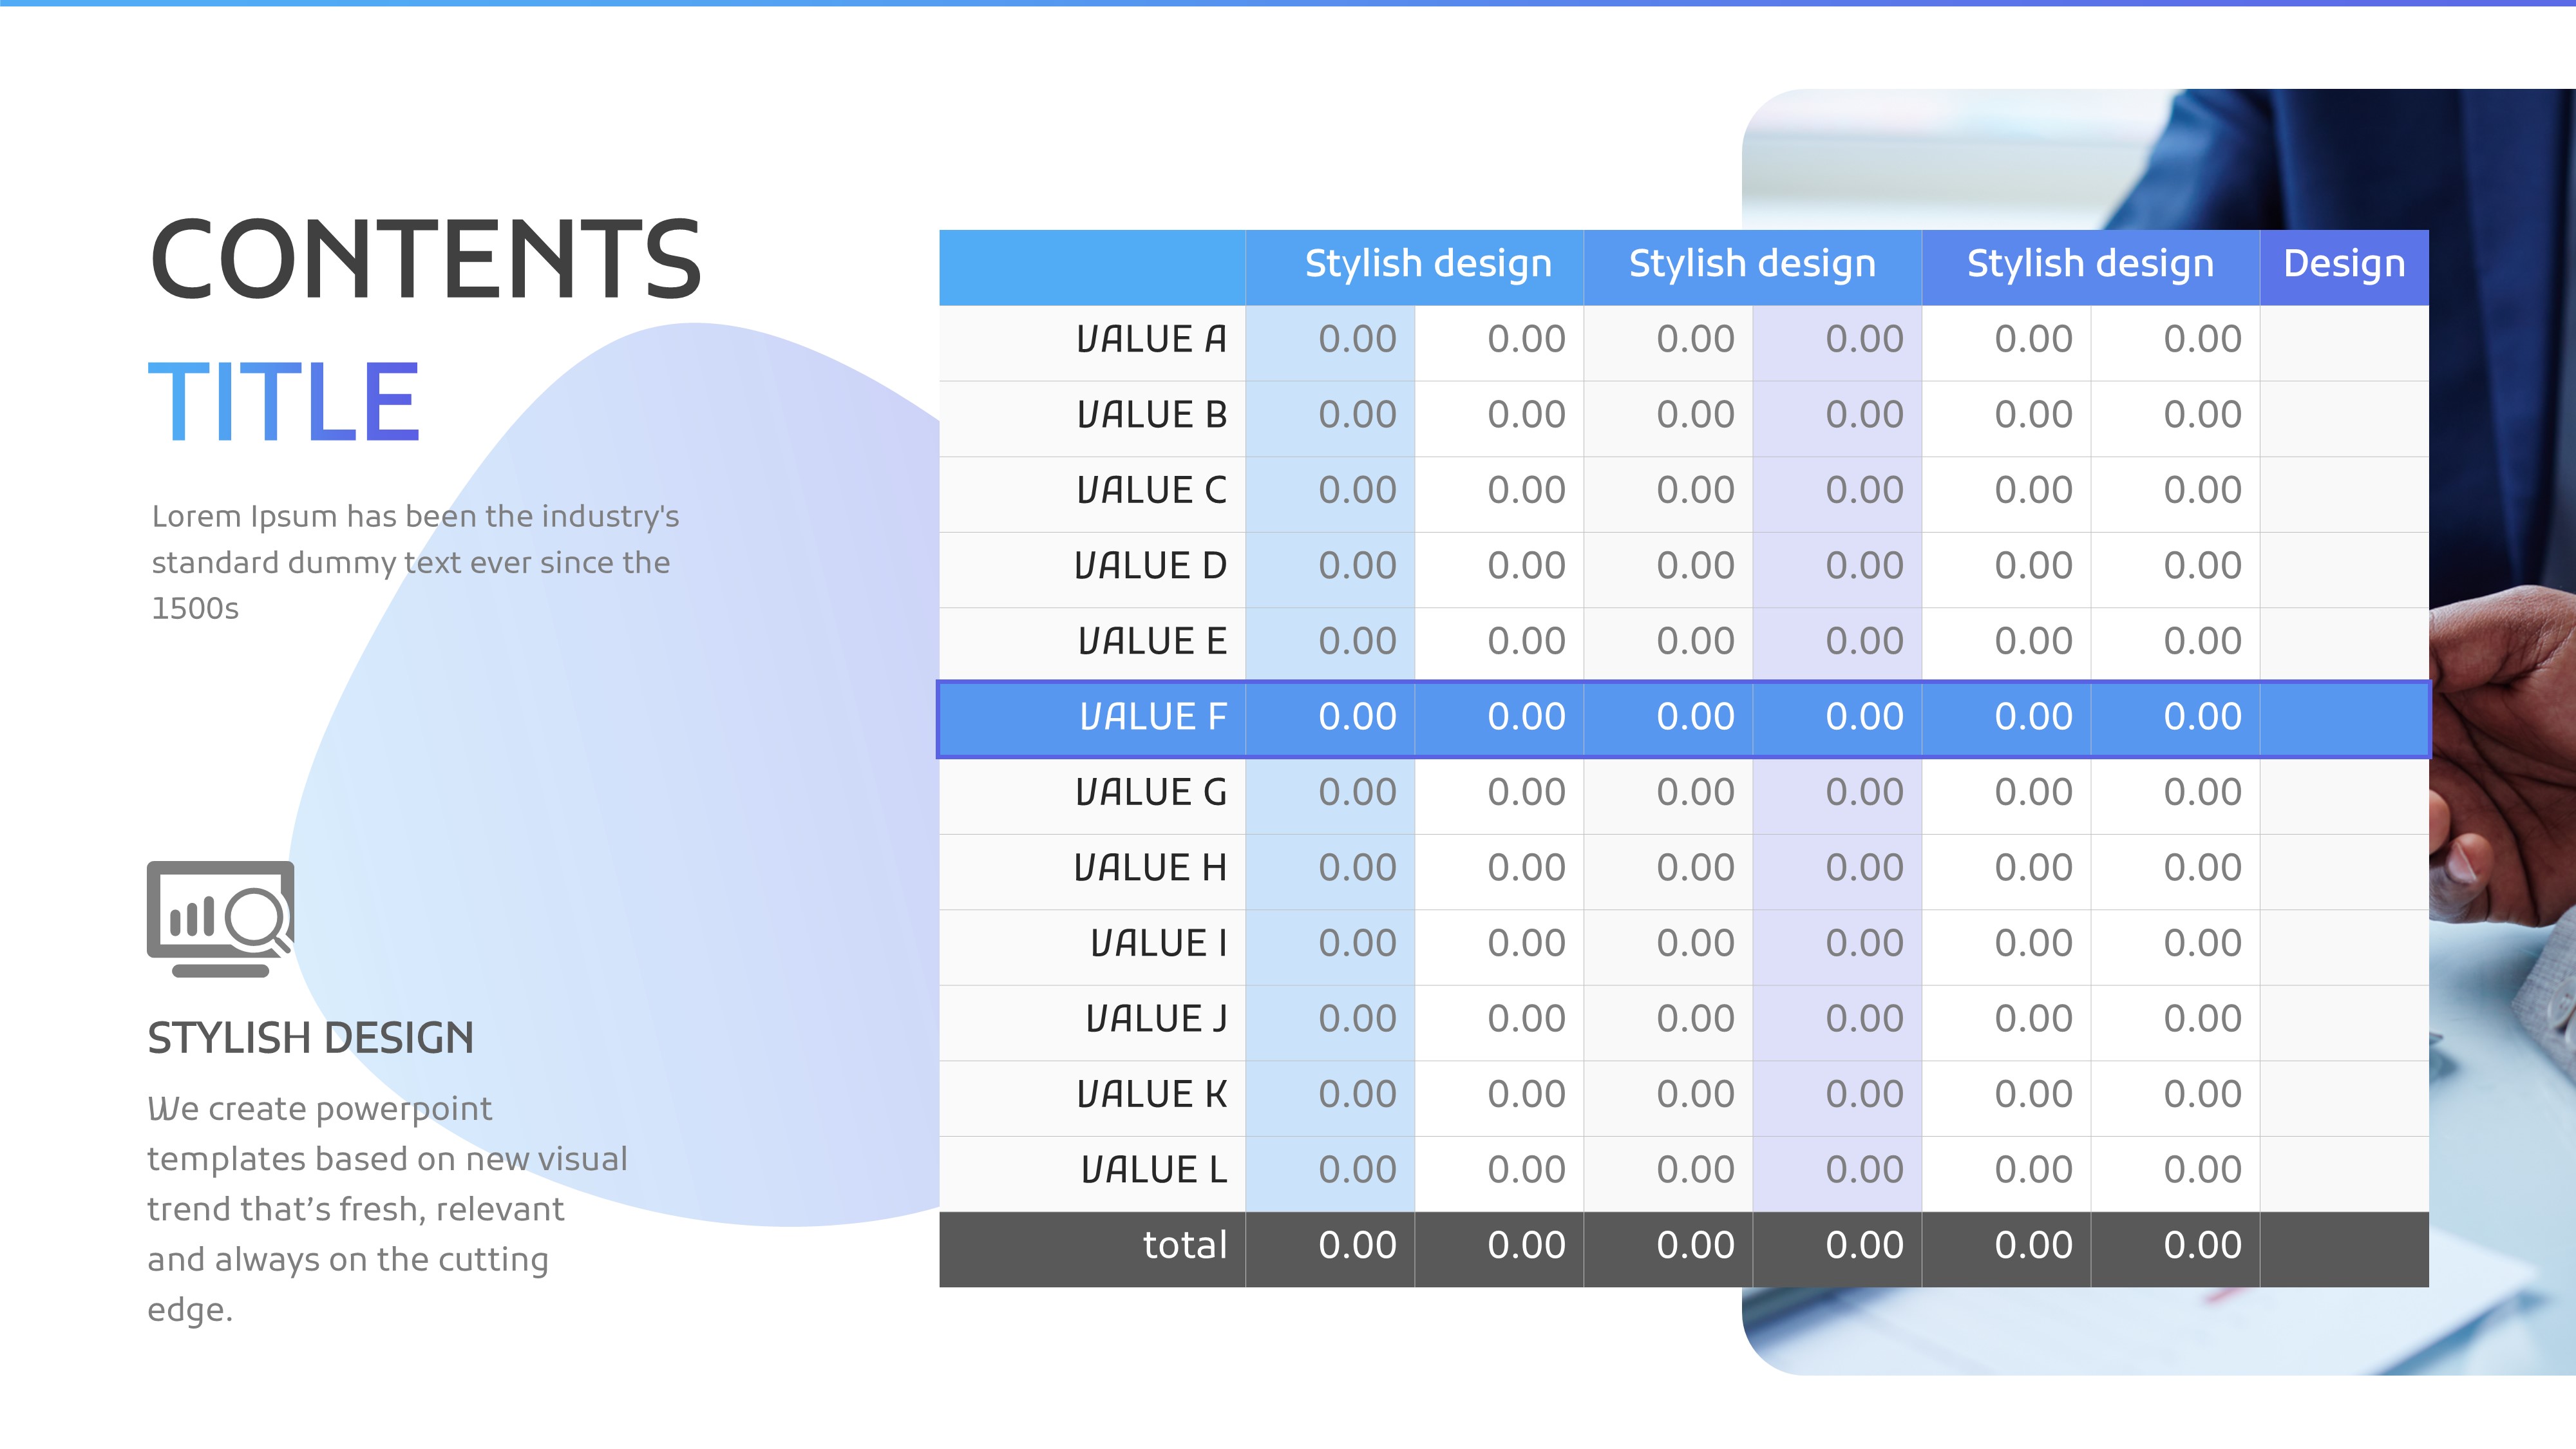
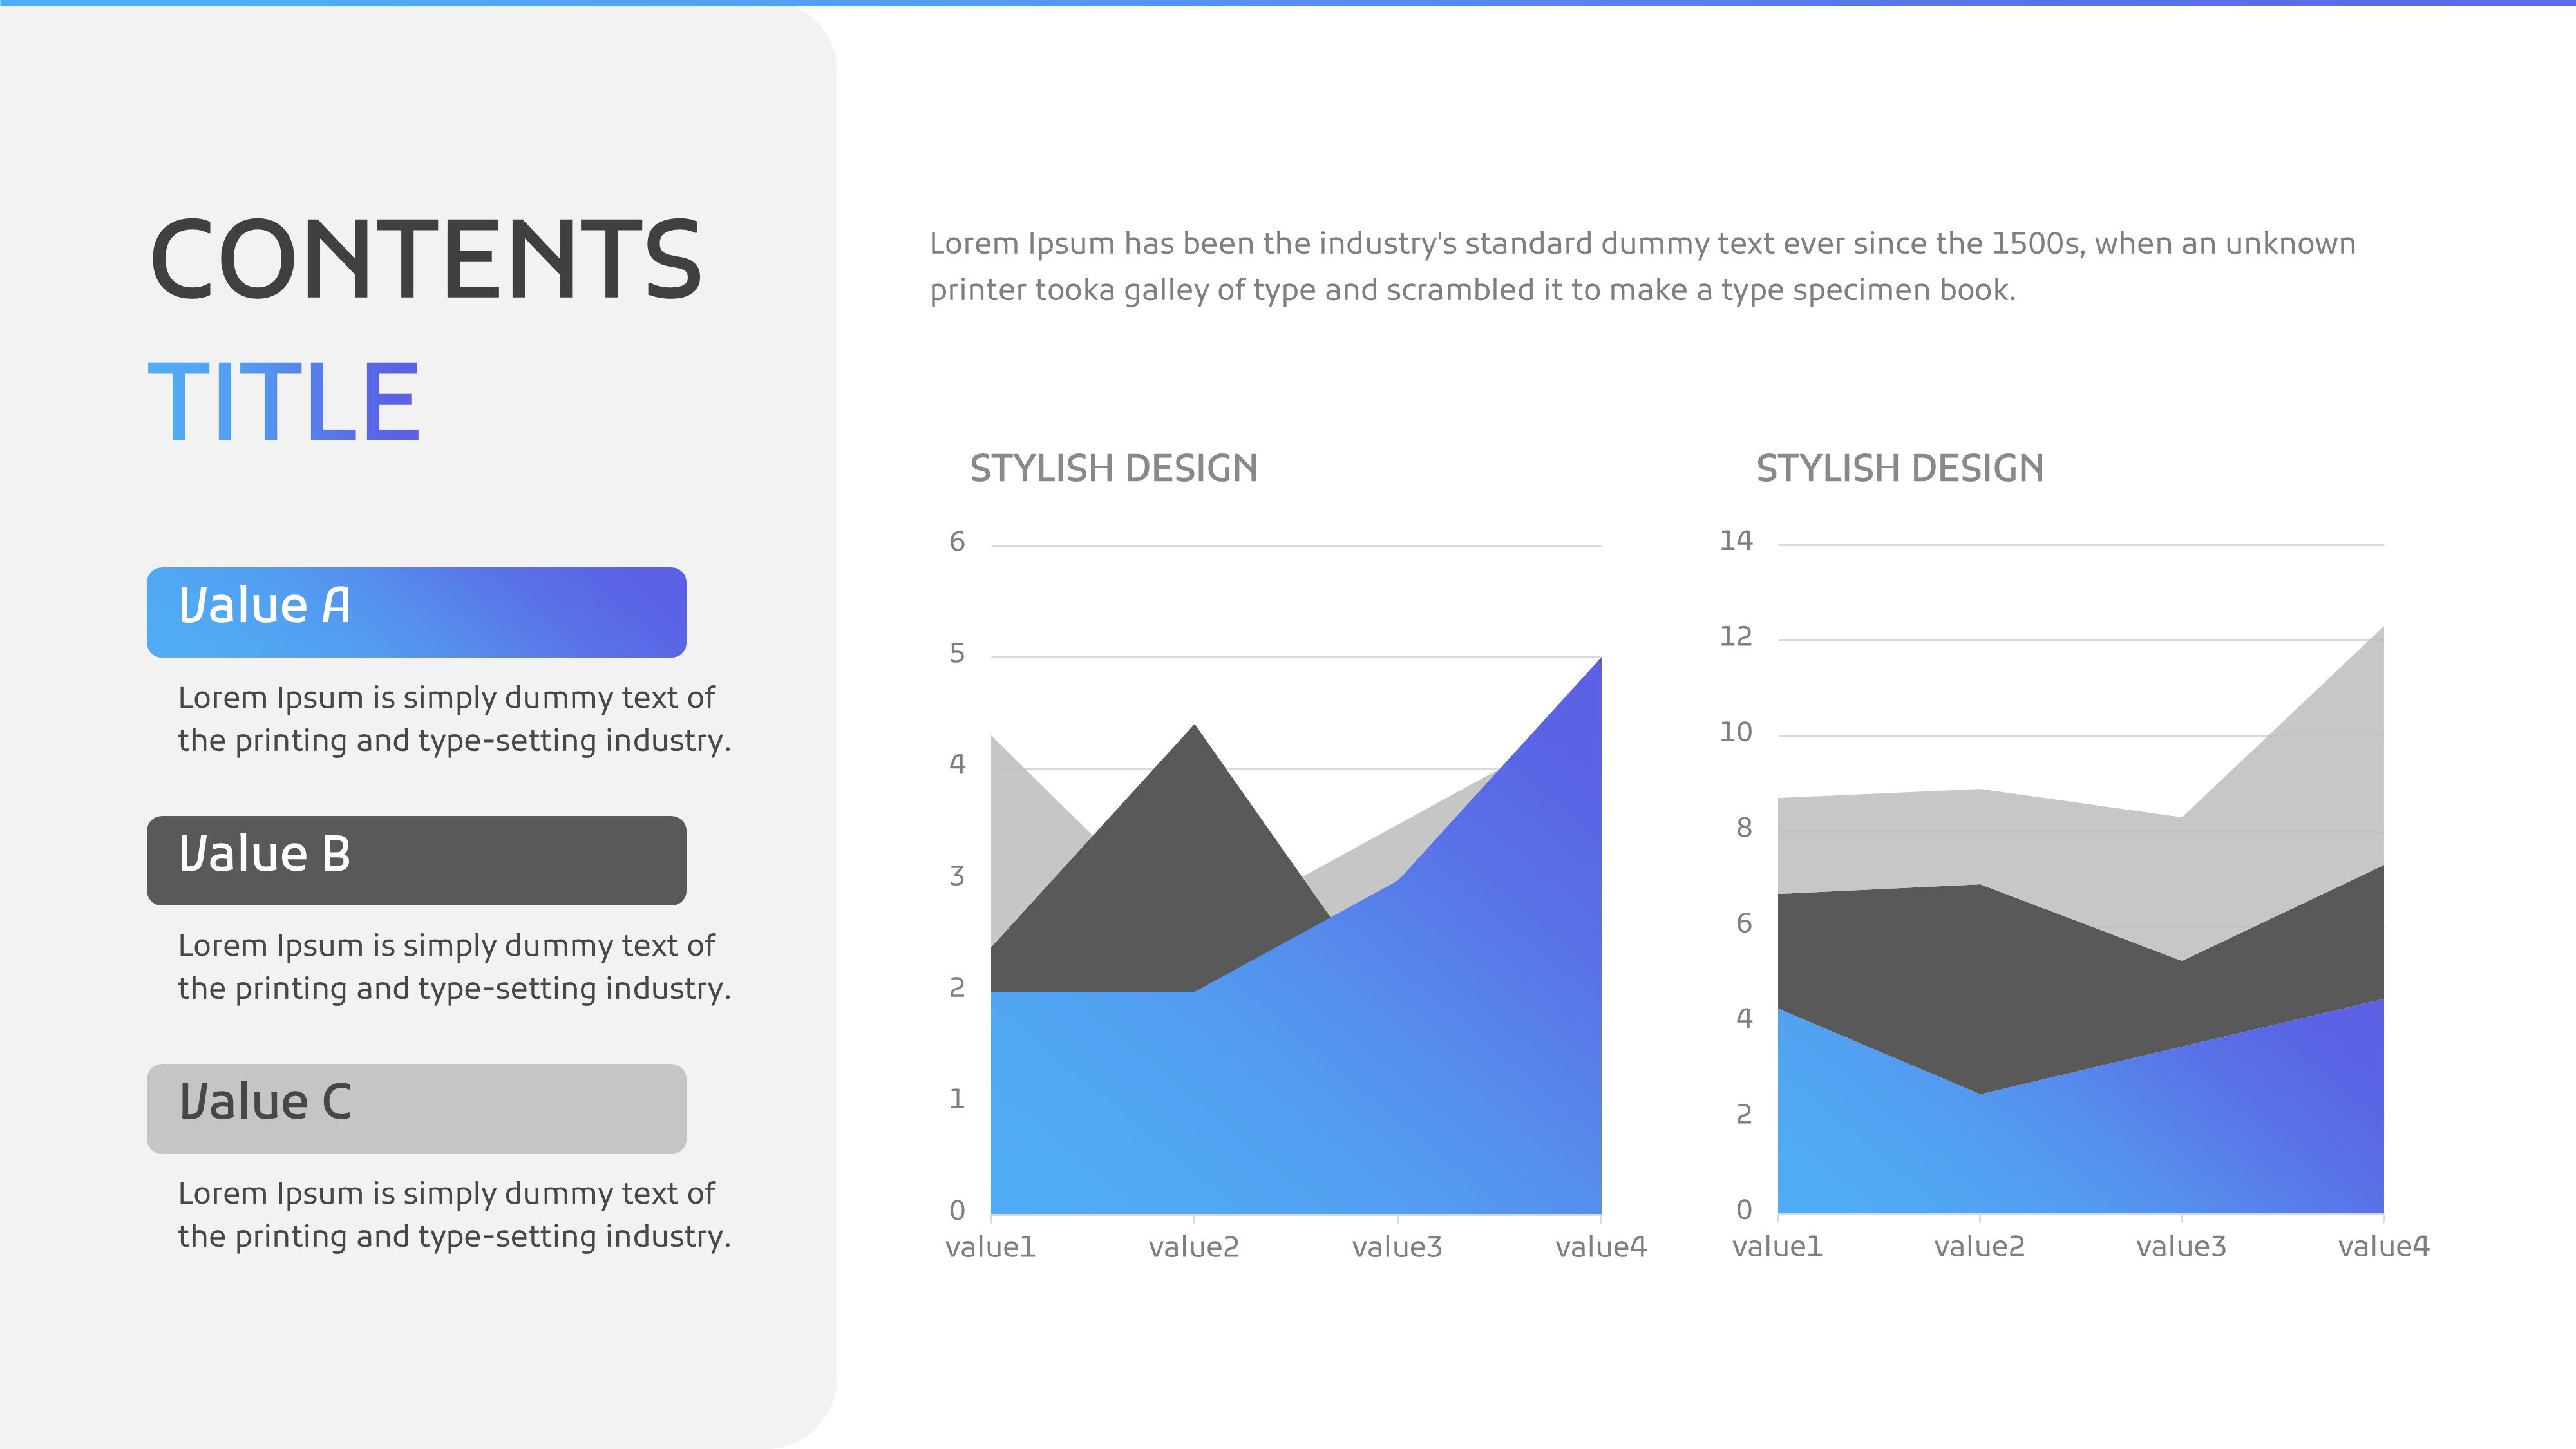
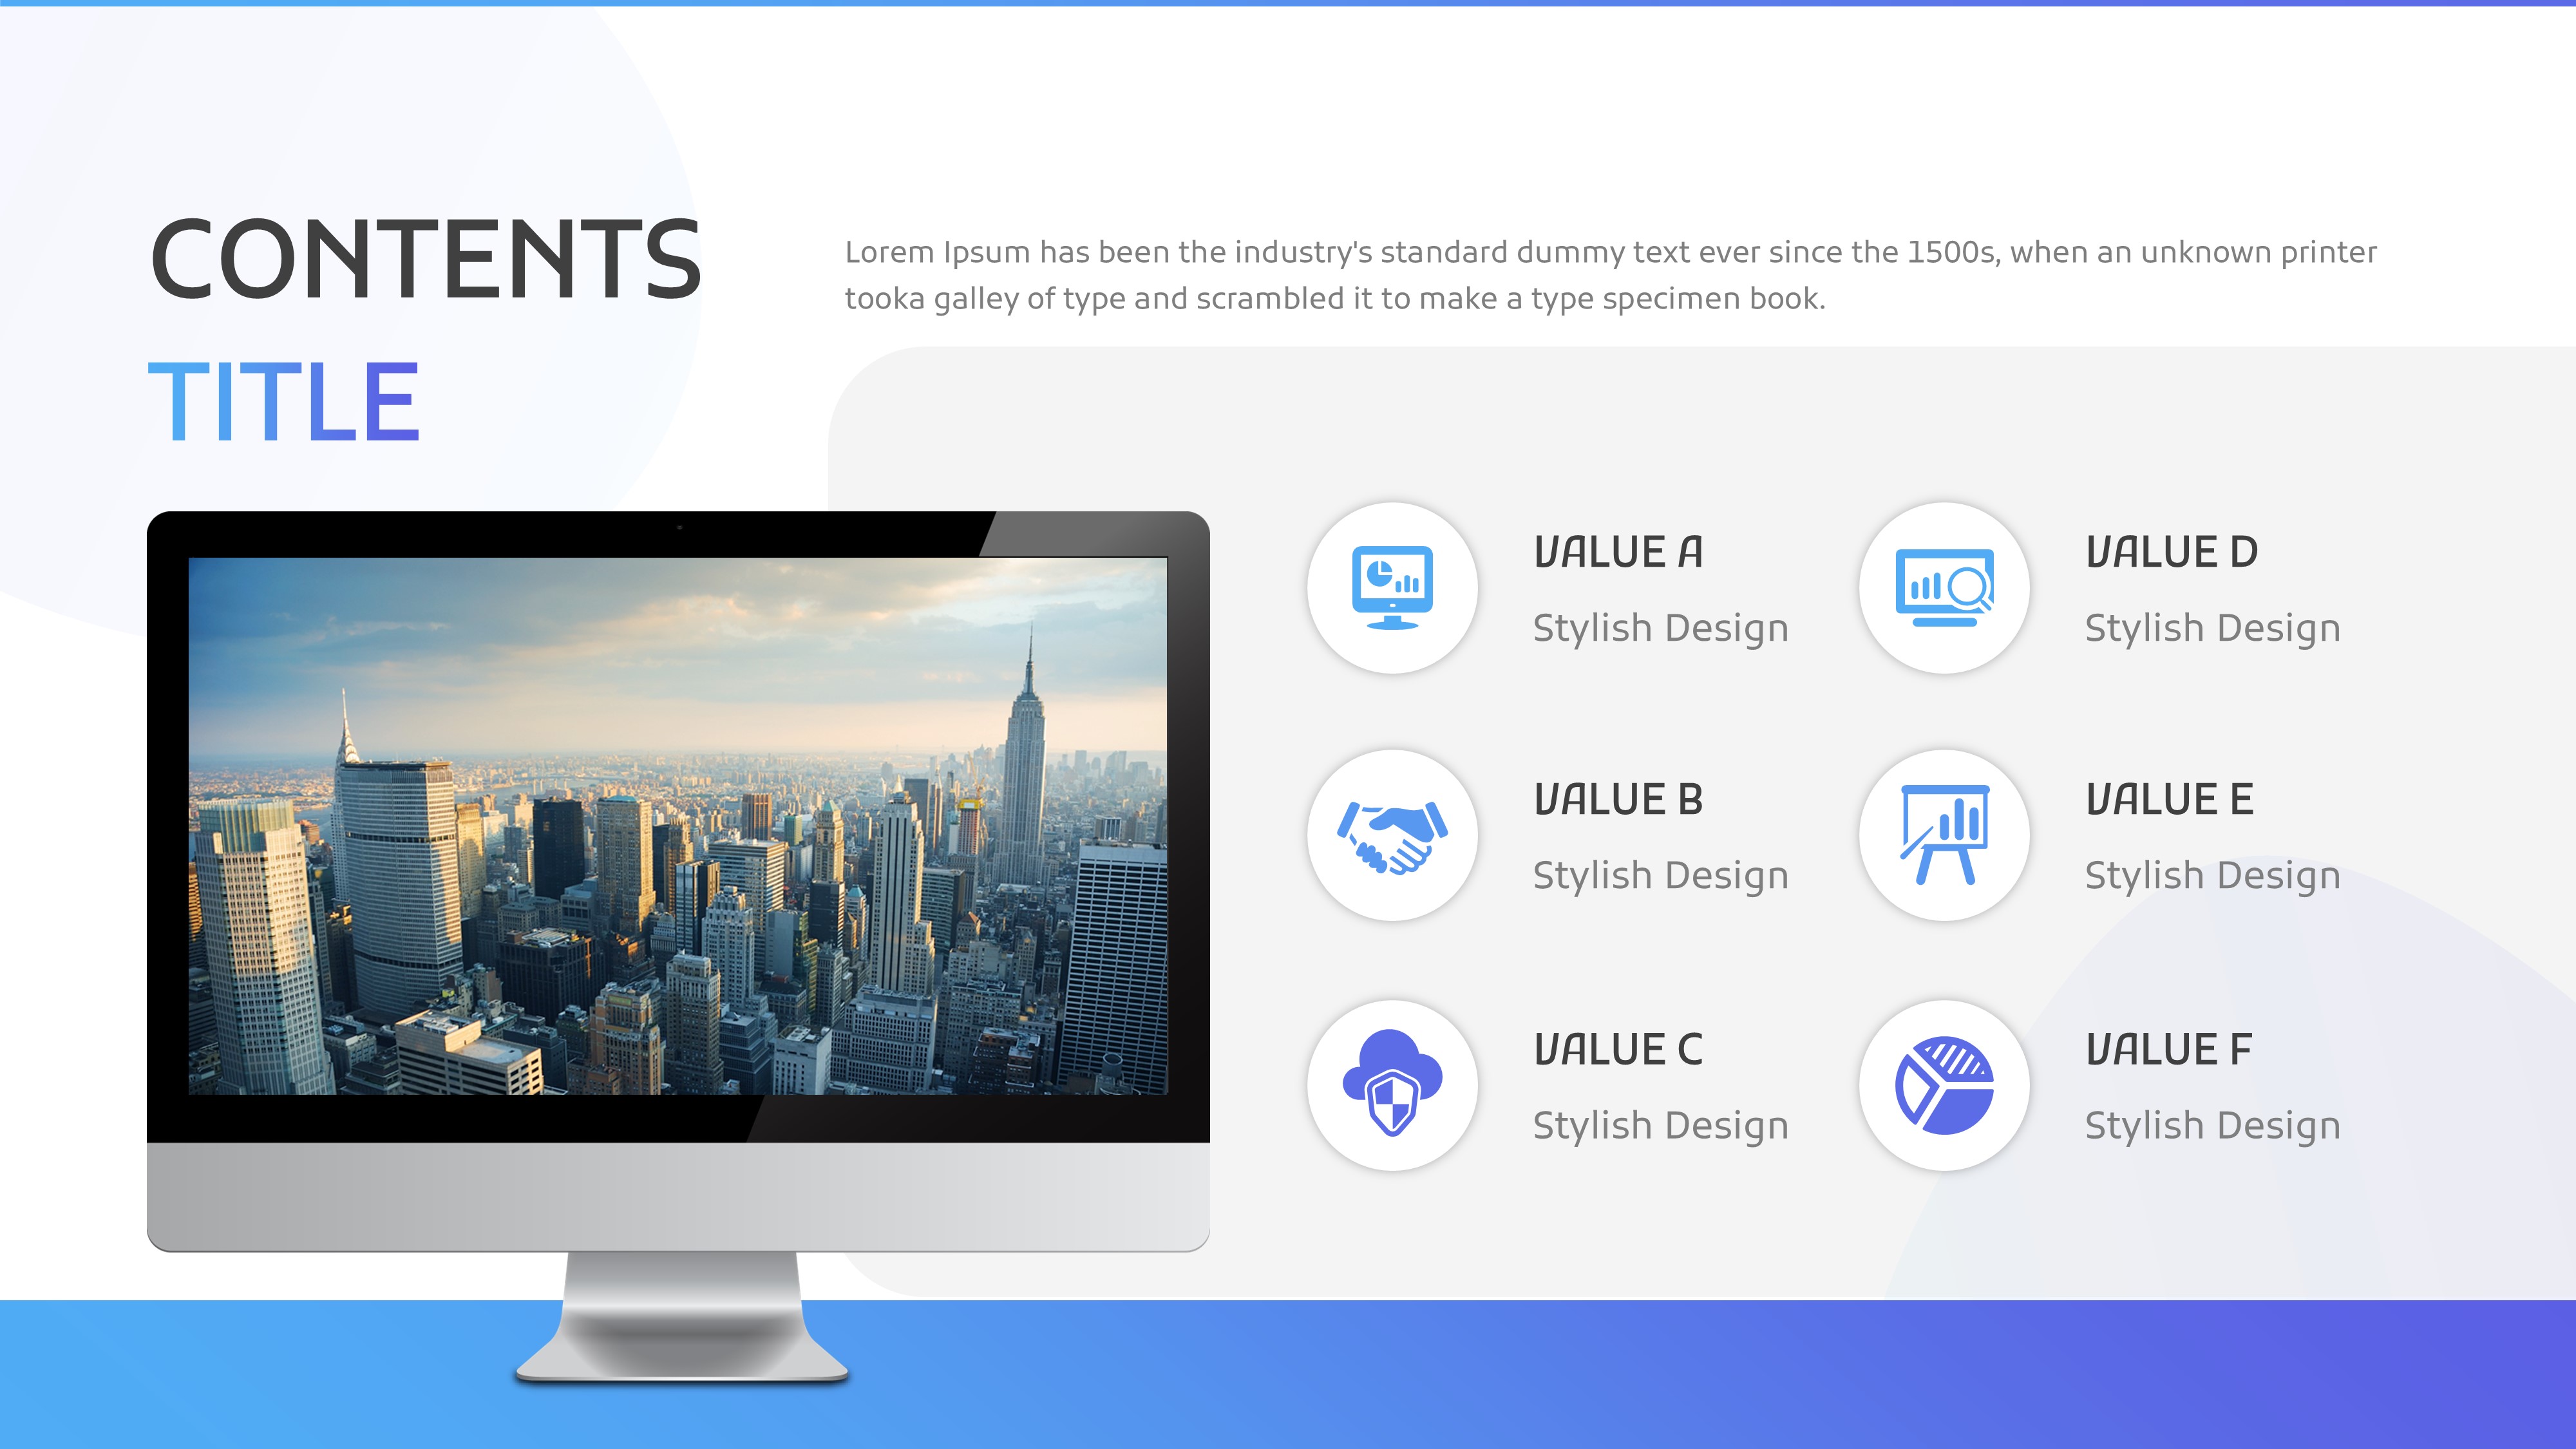
Includes a cover slide with blue gradient and isometric dashboard illustration, three-column card layout, dark-blue two-panel comparison, monitor image with six-icon grid, two-column text-and-photo layout, and line graph or area chart data visualization slides — 30 slides total.
Related Products
-

Weather Forecast Presentation Template – Intuitive and Sleek Design
#IT/Computer
-

Application PowerPoint Wide Template – Sleek Design and Practicality
#IT/Computer
-

Camera APP Presentation Template – Sleek and Modern Design
#IT/Computer
-

Car Safety PowerPoint Template – Innovative IT Slide Design
#IT/Computer
