Data Analysis Core Competencies Slide – Visualizing Business Strategy
RJ0400063_18
- Last Update 06/04/2025
- File Size 0.7MB
- # of Slides 2
- File Format PPTX
- Slide Ratio 16:9
- Color
Keywords
- #Content-Based Slides
- #Design-Based Slides
- #Business Vision and Strategy
- #Diagram
- #Business Vision
- #Core Competencies
- #Cluster
- #Closed Cluster Diagram
- #16:9
- #central radial diagram PowerPoint
- #hub-and-spoke slide template
- #4-node diagram presentation
- #data analysis PowerPoint slide
- #business strategy visualization template
About the Product
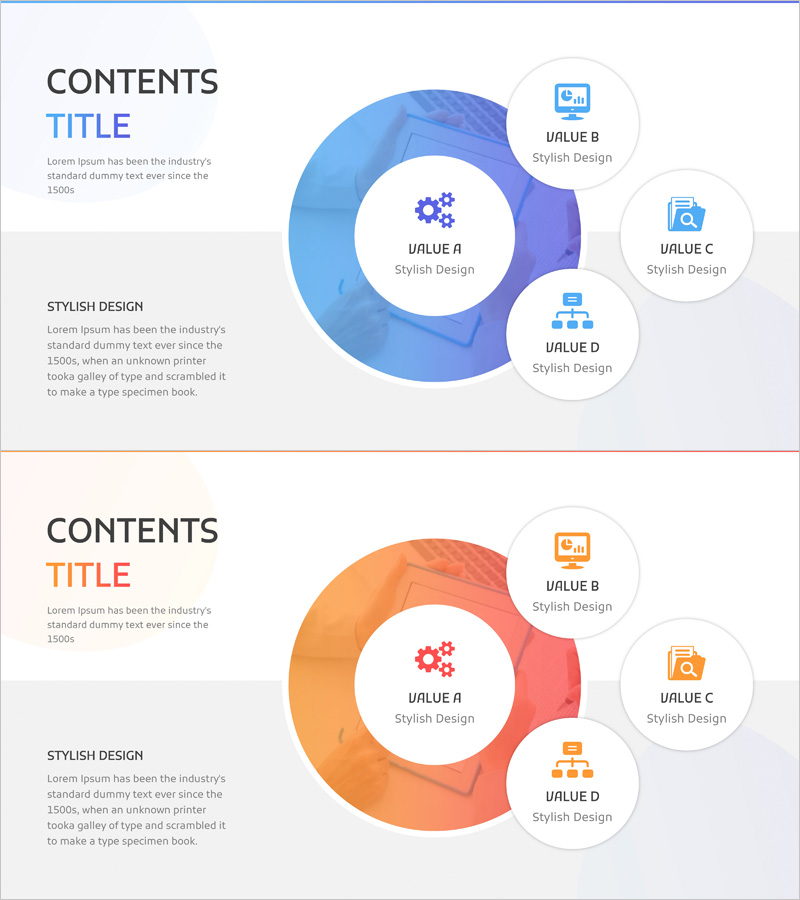
A PowerPoint slide featuring a central hub-and-spoke diagram with four satellite nodes to visualize data analysis competencies and business strategy. The design uses a blue gradient central circle surrounded by four white circular nodes, each with icon placeholders and editable text areas. This slide deck is ideal for presenting organizational capabilities, strategic frameworks, role definitions, and analytical insights in business presentations. Two-slide set includes both blue and orange color variants, optimized for 16:9 widescreen format, with fully editable elements for quick customization.
Usage Points
-
Main Usage
Designed to present core competencies, strategic pillars, or central concepts broken down into four key components. Perfect for visualizing data analysis frameworks, business model analysis, organizational structures, marketing strategy pillars, and any hub-and-spoke relationship requiring clear visual hierarchy.
-
How to Use
Enter your core concept in the central node (e.g., Data Analysis, Business Strategy), then add specific items and descriptions to each of the four satellite nodes. Customize node icons to match your organization's branding, and adjust colors to align with corporate identity guidelines.
-
Recommended For
Executive presentations, strategic planning decks, data analysis reports, organizational capability assessments, product/service value proposition slides, marketing strategy frameworks, consulting reports, and business development pitches.
-
Slide Structure
Two-slide set: blue-toned version with central hub node and four surrounding satellite nodes (each with icon and text input areas) plus orange-toned version with identical layout. 16:9 widescreen format, PPTX file with all elements fully editable and customizable.
Related Products
-

Space Industry Vision Diagram – Innovation and Advancement
#Business Vision and Strategy #Diagram #Business Vision
-

Space Industry Business Vision Closure Diagram
#Business Vision and Strategy #Diagram #Business Vision
-

Pill Key Ingredients Diagram – Business Vision and Strategy
#Business Vision and Strategy #Diagram #Business Vision
-

Financial Business Vision – Cluster Diagram
#Business Vision and Strategy #Diagram #Business Vision
