Competitor Analysis Comparison Area Graph – Visualizing Competitive Edge Data
RJ0400063_22
- Last Update 06/04/2025
- File Size 0.4MB
- # of Slides 2
- File Format PPTX
- Slide Ratio 16:9
- Color
Keywords
About the Product
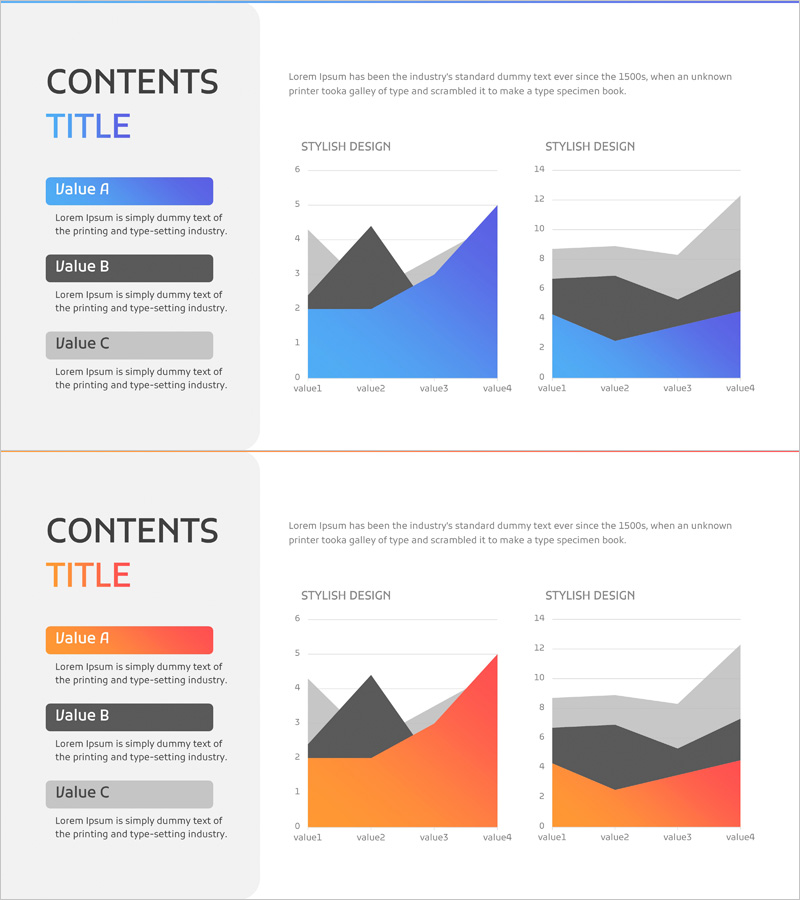
This slide utilizes a comparison area graph for competitor analysis to visually emphasize competitive edge in the market. The striking contrast of blue and red provides clarity for the information, while the dynamic layout of the graph elegantly represents data flow. It is useful for competitor analysis, market share comparisons, and formulating business strategies, allowing users to effectively analyze and understand data. This slide is particularly practical for presentations, proposals, and internal reports.
Usage Points
-
Main Usage
- This template is ideal for conducting comprehensive competitor analyses during strategic meetings, providing insights into market positions.
-
How to Use
- Utilize this slide during team presentations to facilitate discussions on market trends and inform decision-making processes, enhancing strategic planning efforts.
-
Recommended For
- This set is particularly beneficial for business analysts and marketing teams who need to present data-driven insights in client proposals or internal reviews.
-
Slide Structure
- The overall design includes multiple segments that guide the audience through a logical flow of data comparison, ensuring clarity in presenting various market metrics.
Related Products
-

Area Graph for Business Area Analysis
#Market and Competitor Analysis #Graph #Other
-

Mobile App Competitor Analysis – Visualizing Market Share
#Market and Competitor Analysis #Graph #Other
-

Area Graph of Comparative Analysis by Year
#Market and Competitor Analysis #Graph #Other
-

Business Analysis Chart – Visualizing Competitive Advantage
#Market and Competitor Analysis #Graph #Other
