Data Analysis Business Structure Slide – Strategy and Cluster
RJ0400063_7
- Last Update 06/04/2025
- File Size 0.9MB
- # of Slides 2
- File Format PPTX
- Slide Ratio 16:9
- Color
Keywords
- #Content-Based Slides
- #Design-Based Slides
- #Product/Service Introduction
- #Business Vision and Strategy
- #Diagram
- #Composition
- #Business Background and Necessity
- #Cluster
- #Closed Cluster Diagram
- #16:9
- #cluster diagram PowerPoint
- #data analysis presentation slide
- #business structure diagram
- #chart dashboard PPT
- #strategy analysis slide template
About the Product
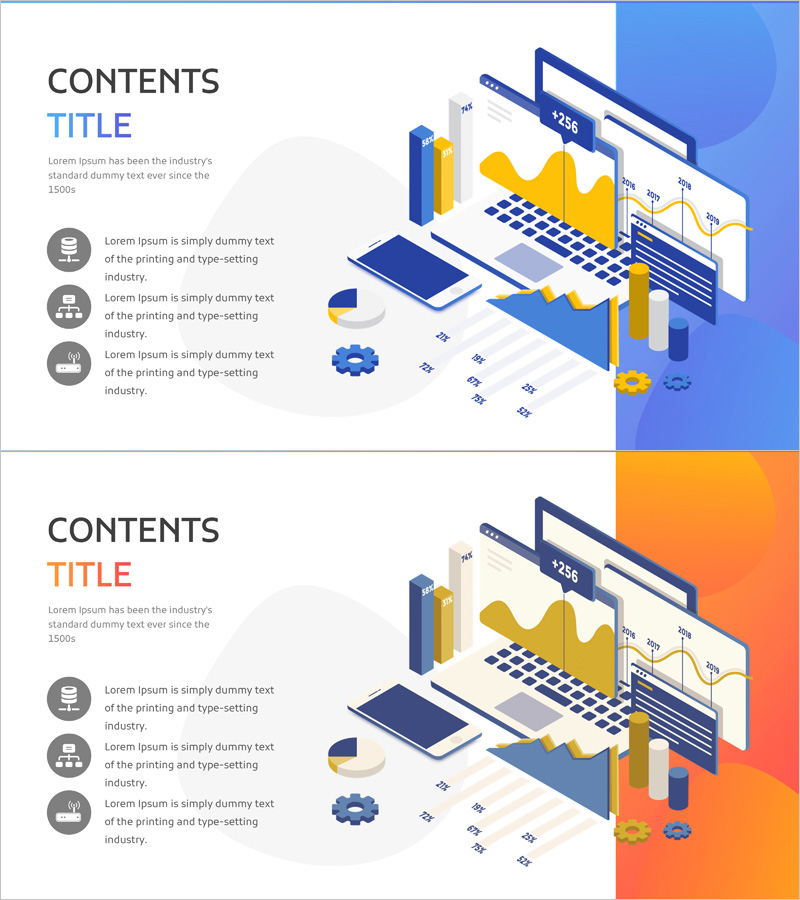
A professional cluster diagram PowerPoint slide designed for data analysis and business strategy presentations. This 2-slide PPTX template features a navy, yellow, and white color scheme with integrated bar charts, pie charts, and line graphs for comprehensive data visualization. The left side includes icon-based text areas for key points, while the right side displays a dashboard-style chart layout for clustering analysis and strategic insights. The 16:9 widescreen format is fully editable and ready for executive reports, business strategy presentations, and data analysis result sharing across various corporate settings.
Usage Points
-
Main Usage
This slide optimizes the visualization of complex data analysis results, business strategies, market segmentation, and customer clustering on a single screen. By combining bar, pie, and line charts with icon-based text areas, it enables simultaneous communication of quantitative data and qualitative explanations to stakeholders.
-
How to Use
Enter 3-4 key points in the left icon areas and update the right chart section with actual data. Maintain the navy and yellow color scheme while editing chart values, legends, and labels to create a professional data analysis slide. Suitable for executive reports, quarterly performance presentations, and strategic meeting materials.
-
Recommended For
Data analysts, business strategy managers, marketing leaders, executive report writers, and consultants presenting market analysis, customer segmentation, and business performance results. Particularly effective when communicating both quantitative data and strategic insights to decision-makers.
-
Slide Structure
2-slide template with each slide featuring a left section containing 3 icon-based text boxes (circular icons with editable text areas) and a right dashboard-style chart area (2 bar charts, 1 pie chart, 1 line graph, and small icon clusters). A curved navy background design element in the upper right provides visual emphasis.
Related Products
-

Introduce Your Signature Tea - Innovative Product Vision
#Product/Service Introduction #Business Vision and Strategy #Diagram
-

Modern Wide PowerPoint Template Donut Chart - Visualizing Revenue Model
#Product/Service Introduction #Business Introduction #Diagram
-

Business Strategy Slide with Cluster Diagram and Text Boxes
#Business Vision and Strategy #Business Strategy #Diagram
-

Unlocking Insights with 3D Cubes – Cluster Diagram for Effective Information Delivery
#Product/Service Introduction #Diagram #Features
