Data Analysis Illustration Template Section Slide 02 – Visual Storytelling for Business
RJ0400063_12
- Last Update 06/04/2025
- File Size 0.7MB
- # of Slides 2
- File Format PPTX
- Slide Ratio 16:9
- Color
Keywords
About the Product
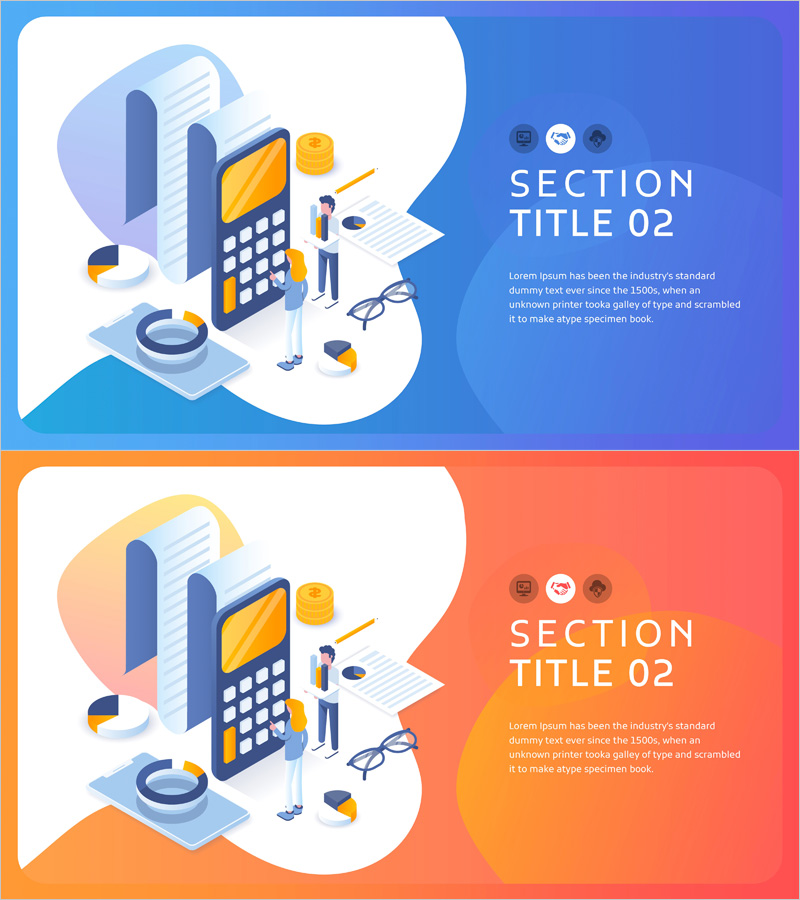
A 2-slide PowerPoint section divider template designed to mark transitions between major sections in business presentations. The slides feature a dual-tone background in blue and orange with data-related illustrations including calculator, documents, coins, and glasses, making them ideal for financial reports, marketing plans, and business analysis decks. Available in 16:9 widescreen PPTX format with fully editable text areas and icon placement zones. The layout provides ample space for section titles and descriptions, allowing you to customize content while maintaining visual consistency. Perfect for enhancing presentation flow and refocusing audience attention during section changes.
Usage Points
-
Main Usage
Clearly mark section boundaries in presentations and refocus audience attention during transitions. Use these divider slides in financial reports, marketing strategies, and business analyses to strengthen the structural flow of your presentation.
-
How to Use
Enter your section title in the text box on the right side of each slide. Add section descriptions in the subtitle area if needed. Choose between blue or orange backgrounds, or alternate between them for visual variety throughout your presentation.
-
Recommended For
Recommended for financial analysis reports, marketing plans, business proposals, investor pitch decks, and data-driven presentations where clear section divisions enhance understanding. Particularly effective in presentations requiring structured information flow and visual emphasis.
-
Slide Structure
Two-slide set with blue background version and orange background version. Each slide divides content into left illustration area (calculator, documents, coins, glasses) and right text input area (section title, subtitle, description), creating clear information hierarchy.
Related Products
-

Astronomy Observation Template Section Slide – A New Way to Explore the Universe
#Slide Type #Section Cover
-

Clean Science Experiment Template – Style and Usability
#Slide Type #Section Cover
-

Food Truck Project Section Cover – Template Highlighting Business Concept
#Slide Type #Section Cover
-

Modern Simple Business Plan Template Section Slide
#Slide Type #Section Cover
