Visualizing PC Data Analysis Business Area PPT – Cluster and Connection
RJ0400063_16
- Last Update 06/04/2025
- File Size 0.4MB
- # of Slides 2
- File Format PPTX
- Slide Ratio 16:9
- Color
Keywords
- #Content-Based Slides
- #Design-Based Slides
- #Company Introduction
- #Business Introduction
- #Diagram
- #Business Areas
- #Business Areas
- #Cluster
- #Spread
- #Chain Diagram
- #Centralized Diagram
- #16:9
- #radial diagram PowerPoint
- #cluster diagram slide template
- #central connection diagram
- #business area visualization
- #data analysis PowerPoint slide
About the Product
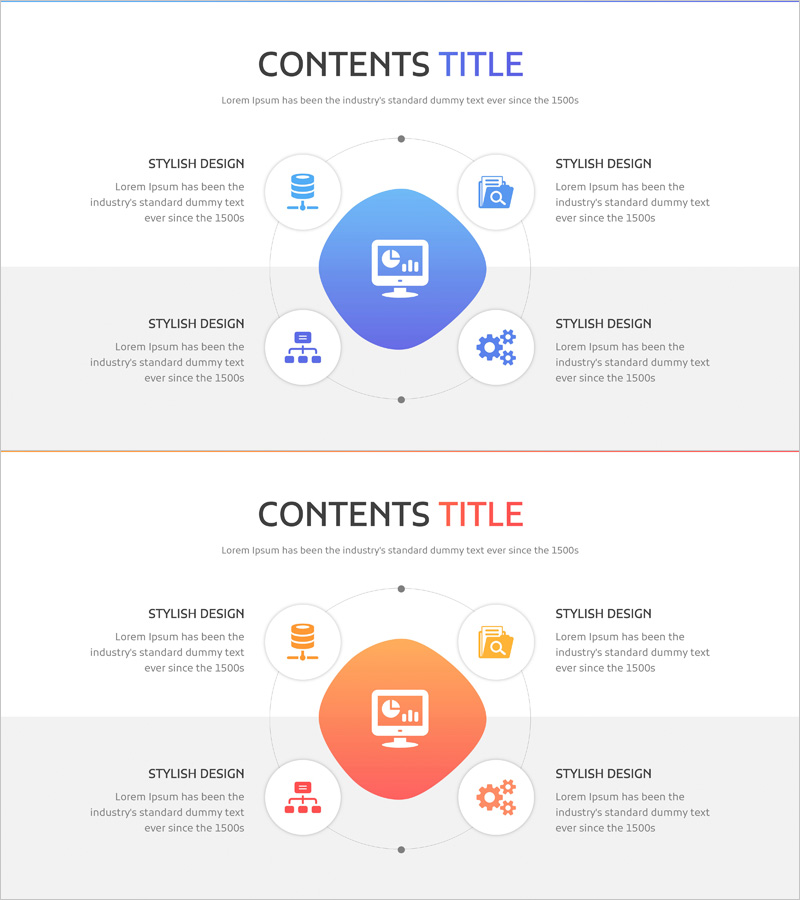
A radial cluster diagram PowerPoint slide that expands from a central concept to five key business areas with connecting lines. This presentation template visualizes data analysis domains, business portfolios, organizational capabilities, and technology ecosystems through a hub-and-spoke structure. The blue-toned central circular node connects to surrounding elements with icons and text fields, making it ideal for illustrating hierarchical relationships and multi-dimensional business concepts in corporate presentations.
Usage Points
-
Main Usage
Visualizes relationships that radiate from a central concept or core theme to five key domains, capabilities, or products. Effectively communicates business portfolio structures, organizational core competencies, product ecosystems, technology stacks, and hub-and-spoke relationship models in executive presentations and strategic briefings.
-
How to Use
Enter the core concept (e.g., PC Data Analysis) in the central blue circular node, then populate the five surrounding areas with detailed items such as data collection, analysis, visualization, reporting, and application. Customize the icons and text in each node to match your presentation content, then insert into business briefings, strategy presentations, or product introduction slides.
-
Recommended For
Ideal for business strategy and portfolio presentations, organizational capability overviews, product ecosystem explanations, technology architecture visualization, marketing plan business area analysis, and investor pitch decks explaining business models. Recommended for executives, planning teams, marketing departments, and technical teams presenting to stakeholders.
-
Slide Structure
Two-slide set. The first slide features a blue-toned radial structure with a central circular node (core concept) connecting to five surrounding nodes (domains/capabilities) via connecting lines, each with icon and text input areas. The second slide presents the same structure in orange tone, allowing flexible color selection based on presentation context and branding requirements.
Related Products
-

Fountain Pen Business Area Diagram – Overview for Business Presentation
#Company Introduction #Business Introduction #Diagram
-

Business Area Flower Diagram – Ideal for Company Introductions
#Company Introduction #Business Introduction #Diagram
-

Mobile Financial Services Business Area Slide
#Company Introduction #Business Introduction #Diagram
-

Linkage Loop Diagram – Explaining Business Fields and Areas
#Company Introduction #Business Introduction #Diagram
