Data Analytics Business Company Overview Slide – Cluster Diagram for Business Areas
RJ0400063_6
- Last Update 06/04/2025
- File Size 2.5MB
- # of Slides 2
- File Format PPTX
- Slide Ratio 16:9
- Color
Keywords
- #Content-Based Slides
- #Design-Based Slides
- #Company Introduction
- #Business Introduction
- #Diagram
- #Company Overview
- #Business Areas
- #Cluster
- #Closed Cluster Diagram
- #16:9
- #cluster diagram PowerPoint
- #business structure slide
- #4-area diagram template
- #company overview presentation
- #business area visualization PPT
About the Product
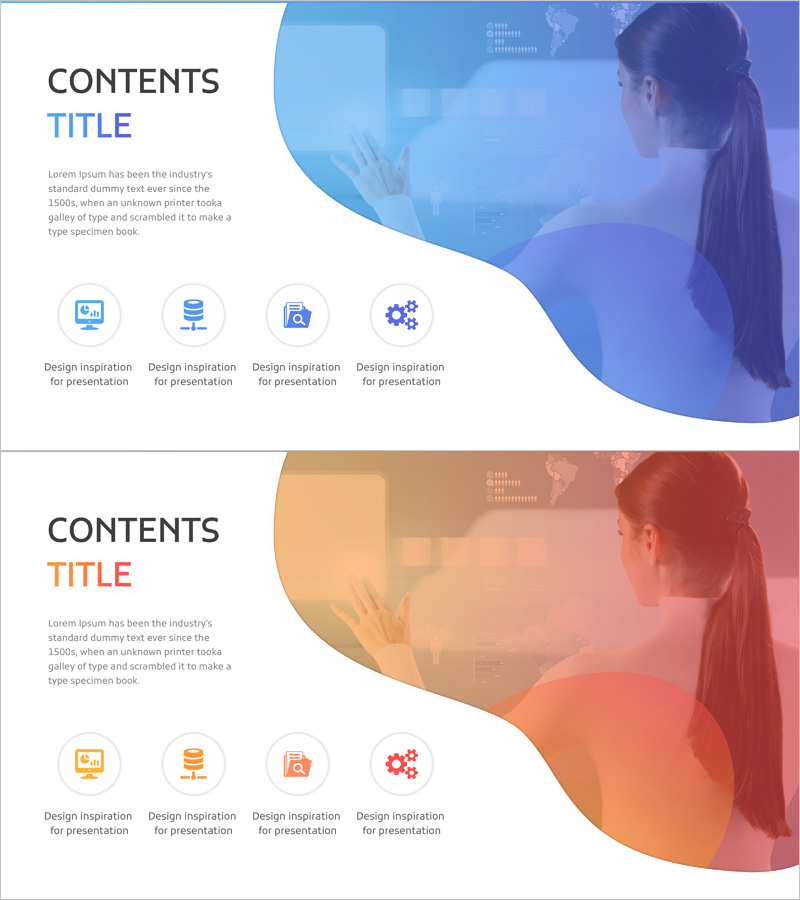
A PowerPoint slide that visualizes business areas and organizational structure using a 4-cluster diagram format. The design features a central core concept surrounded by four overlapping cluster areas, with a blue gradient background and white icons conveying professionalism. This diagram slide is ideal for company overview and business introduction sections, enabling clear communication of organizational capabilities and business scope at a glance. The 16:9 format includes 2 slides ready for immediate editing and customization.
Usage Points
-
Main Usage
Communicate organizational structure and core business areas through a 4-cluster visual framework. Suitable for data analytics firms, business consulting agencies, marketing firms, and service providers to clearly present business scope and competencies in presentations.
-
How to Use
Use as the opening slide in company overview or business introduction sections to provide audiences with an immediate understanding of organizational structure. Edit cluster labels to reflect actual business divisions and replace icons as needed to match your industry and branding.
-
Recommended For
Data analytics companies, IT consulting agencies, marketing service providers, and business solution firms presenting to executives, investors, or new employees. Ideal for investor pitch decks, corporate training materials, and stakeholder briefings.
-
Slide Structure
2-slide set featuring a blue gradient background with 4 overlapping clusters on the first slide and an orange-pink gradient version on the second. Each cluster is positioned around a central core concept with dedicated icon and text areas for customization.
Related Products
-

Business Area Cluster Closure – Clear Business Introduction
#Company Introduction #Business Introduction #Diagram
-

Business Introduction using Vision Diagram – Effective Data Visualization
#Company Introduction #Business Introduction #Diagram
-

Construction Business Company Overview – Capturing Business Achievements
#Company Introduction #Business Introduction #Diagram
-

Cluster Diagram for Introduction to Plastic Surgery
#Company Introduction #Diagram #Company Overview
