Sales and Revenue of Data Analysis Services – Optimized Financial Analysis
RJ0400063_21
- Last Update 06/04/2025
- File Size 3.4MB
- # of Slides 2
- File Format PPTX
- Slide Ratio 16:9
- Color
Keywords
- #Content-Based Slides
- #Design-Based Slides
- #Financial Plans and Performance
- #Diagram
- #Income Statement
- #Sales and Revenue
- #Table
- #Standard Table
- #16:9
- #financial data table PowerPoint slide
- #revenue comparison chart
- #profit and loss statement template
- #business performance presentation
- #how to create financial analysis slides in PowerPoint
About the Product
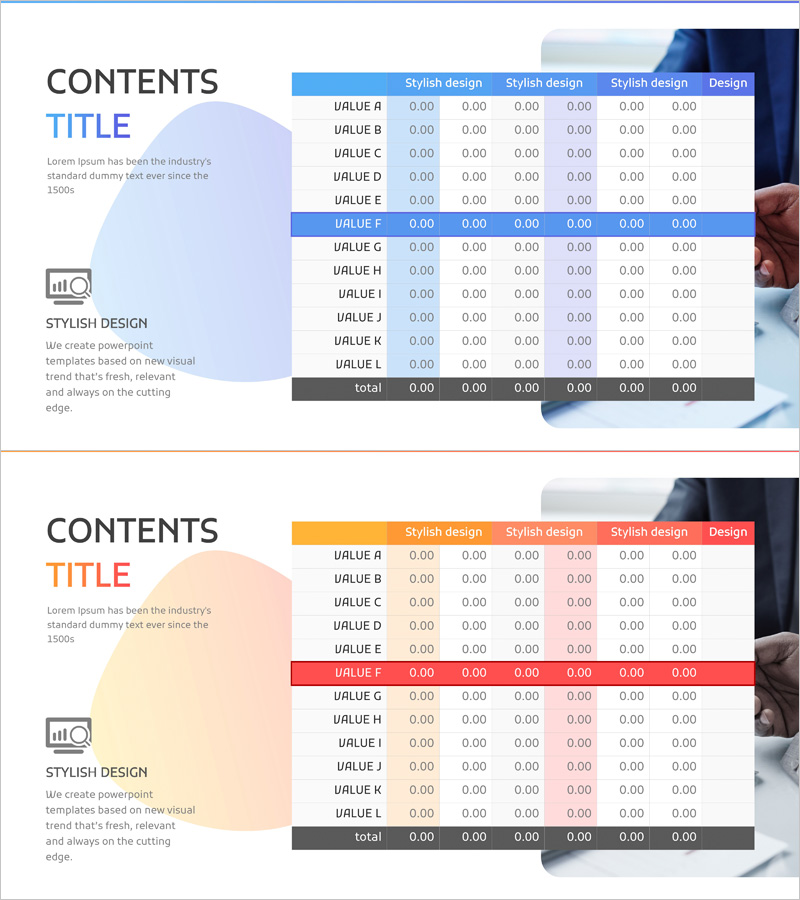
A table-based PowerPoint slide for comparing sales and revenue data of data analysis services at a glance. Featuring a 6-row 5-column structure with six items (VALUE A through F) and five style columns, this slide visualizes financial metrics with a blue header and highlighted row (VALUE F) to emphasize key indicators. Optimized for financial analysis presentations, profit-and-loss statements, business performance reports, and investment pitches. Ready-to-edit PPTX format in 16:9 aspect ratio with 2 slides.
Usage Points
-
Main Usage
Organize and compare financial metrics, sales figures, and revenue data in a structured table format. The blue header and highlighted rows draw attention to key performance indicators, making it ideal for financial analysis and decision-making presentations.
-
How to Use
Use this slide in profit-and-loss statements, financial planning presentations, business performance reports, and investor pitch meetings. Input actual financial figures into each cell and leverage color highlighting to emphasize critical metrics and guide audience focus.
-
Recommended For
Finance managers, CFOs, executives, business analysts, and consultants presenting financial performance. Suitable for startup investor presentations, quarterly earnings reports, business planning meetings, and financial strategy discussions.
-
Slide Structure
6-row 5-column table layout with a blue header row (four Stylish design columns plus one Design column), followed by VALUE A through F data rows, and a total row at the bottom. The VALUE F row is highlighted in red to visually distinguish key financial indicators.
Related Products
-

Profit Analysis Graph – Visualizing Financial Performance
#Financial Plans and Performance #Diagram #Income Statement
-

Transportation Business Sales and Profit Table – Financial Analysis
#Financial Plans and Performance #Diagram #Income Statement
-

Table of Contents for Business Success – Financial Planning and Performance
#Financial Plans and Performance #Diagram #Income Statement
-

Sleek Infographic: Modern Colors and Chart Slide Design
#Financial Plans and Performance #Diagram #Income Statement
