Global Target Market Data Analysis - Insights into Markets
RJ0400063_24
- Last Update 06/04/2025
- File Size 0.5MB
- # of Slides 2
- File Format PPTX
- Slide Ratio 16:9
- Color
Keywords
- #Content-Based Slides
- #Design-Based Slides
- #Market and Competitor Analysis
- #Marketing Plan and Strategy
- #Diagram
- #Other
- #Target Market
- #Target Market Strategy
- #Cluster
- #Closed Cluster Diagram
- #Map
- #16:9
- #world map PowerPoint slide
- #regional market analysis presentation
- #global data visualization
- #geographic market comparison
- #world map slide template download
About the Product
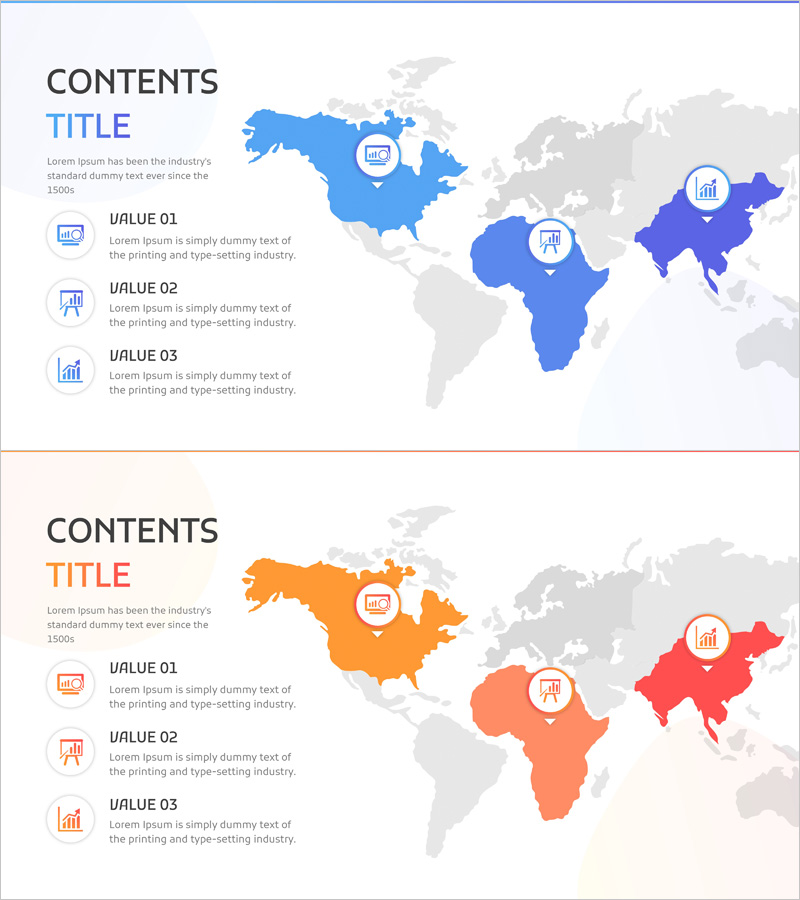
A world map-based PowerPoint slide designed for global market analysis and regional data comparison. This presentation template features two color versions—blue and orange tones—with each slide highlighting three key regions (North America, Africa, and Asia) on a world map, using icons to mark core indicators. Available in 16:9 widescreen PPTX format for immediate editing, this slide deck is ideal for target market selection, competitive analysis, and regional business strategy presentations. Effectively communicate global market insights and geographic data distribution in your business presentations.
Usage Points
-
Main Usage
Visually represent global market analysis and regional data comparison using an interactive world map. Three major regions (North America, Africa, Asia) are color-coded and marked with icons indicating key metrics, making it ideal for target market selection and competitive landscape analysis.
-
How to Use
Incorporate this slide into business plans, marketing strategy presentations, and investor pitch decks within the market analysis section. Input regional data such as sales figures, customer counts, or market share percentages alongside icons and text labels to explain global business strategies. The blue version suits corporate branding, while the orange version conveys creative energy.
-
Recommended For
Executives, marketing teams, and strategy departments in companies pursuing global expansion. Particularly effective for presentations covering international market entry, regional business growth, and competitive environment analysis where geographic information must be communicated intuitively.
-
Slide Structure
Two-slide layout with each slide featuring a world map background highlighting three regions (North America, Africa, Asia) in distinct colors. Three icons are positioned on each region to mark key indicators, with a left-side panel containing VALUE 01, 02, 03 items and descriptive text areas for data input.
Related Products
-

Rocket Launch Progress by Country – Systematic Data Presentation
#Market and Competitor Analysis #Marketing Plan and Strategy #Diagram
-

Analysis of Target Areas on the Korean Peninsula – Utilizing Cluster Diagram
#Market and Competitor Analysis #Marketing Plan and Strategy #Diagram
-

Export Strategy to Target Asian Countries
#Market and Competitor Analysis #Marketing Plan and Strategy #Diagram
-

Asia Map Target Region Strategy
#Market and Competitor Analysis #Marketing Plan and Strategy #Diagram
