Data Analysis Illustration Template Cover – Visual Data Interpretation
RJ0400063
- Last Update 06/04/2025
- File Size 0.6MB
- # of Slides 2
- File Format PPTX
- Slide Ratio 16:9
- Color
Keywords
About the Product
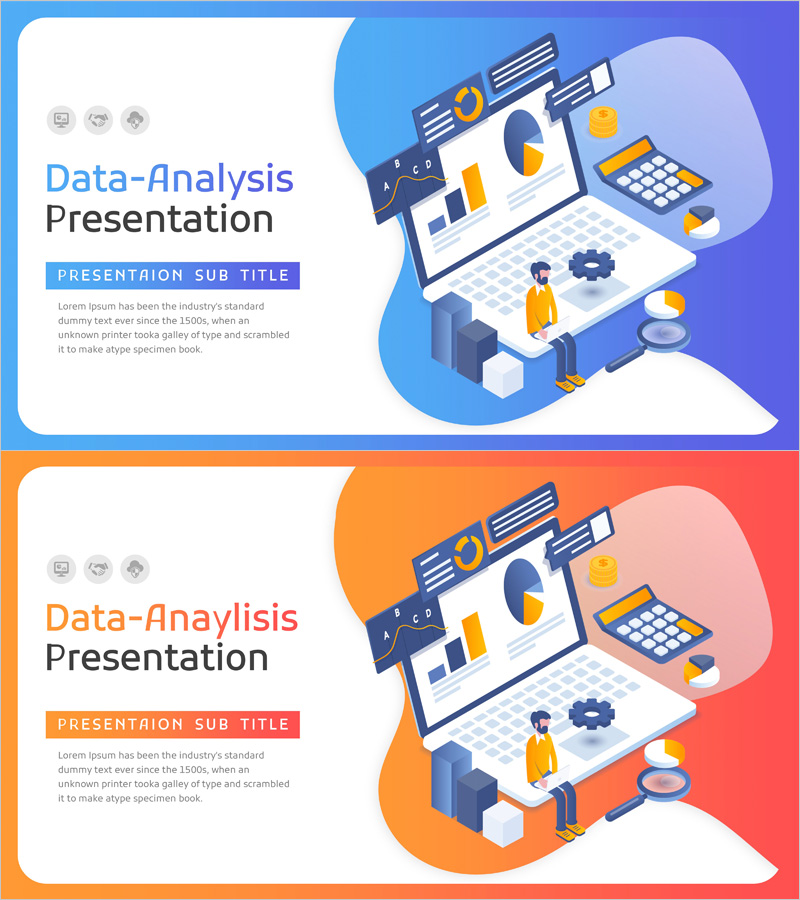
A professional 2-slide cover set designed to launch your data analysis presentation with visual impact. Two color variations—blue and orange—allow you to match your corporate brand or presentation theme. The 3D isometric illustration features charts, a calculator, and data visualization elements that immediately communicate the essence of data-driven analysis. The left side provides a clean white space for your title, subtitle, and descriptive text, while the right side showcases a gradient background with the illustration creating visual balance. Fully editable in PowerPoint format, this slide set is optimized for data analytics reports, market research presentations, business intelligence briefings, and executive dashboards.
Usage Points
-
Main Usage
Serves as the opening slide for data analysis, market research, and business intelligence presentations. The chart and calculator illustrations visually reinforce data-driven decision-making, instantly establishing credibility and professional authority for your analysis topic.
-
How to Use
Enter your presentation title, subtitle, and presenter information in the white text area on the left. Use the blue version for technical, IT, and financial presentations; choose orange for marketing, sales, and creative contexts. Company logos or additional text can be positioned above the illustration on the right side.
-
Recommended For
Ideal for data analysts, business analysts, marketing professionals, financial analysts, and executives presenting quarterly results, market trends, customer insights, and performance metrics. Perfect for any data-driven decision-making presentation requiring professional visual communication.
-
Slide Structure
Two-slide set with one blue-background version and one orange-background version. Each slide features a left-aligned white text zone (title, subtitle, and description in three tiers) and a right-side gradient background with 3D isometric illustration. Optimized for 16:9 widescreen format with balanced composition.
Related Products
-

Grid Company Profile Template Cover – Embodying Professionalism and Trust
#Slide Type #Cover
-

Thinking Office Worker Template Cover – Emphasizing Corporate Vision
#Slide Type #Cover
-

Rounded Edge Cover Slide – Modern Business PowerPoint
#Slide Type #Cover
-

Business Plan Fountain Pen Theme Template Cover
#Slide Type #Cover
