Introduction to Data Analysis Program – Business Vision and Goals
RJ0400063_29
- Last Update 06/04/2025
- File Size 1.6MB
- # of Slides 2
- File Format PPTX
- Slide Ratio 16:9
- Color
Keywords
- #Content-Based Slides
- #Design-Based Slides
- #Product/Service Introduction
- #Business Vision and Strategy
- #Diagram
- #Program Introduction
- #Business Goals
- #Cluster
- #Closed Cluster Diagram
- #16:9
- #closed diagram PowerPoint slide
- #3-item comparison slide
- #business goals presentation
- #data analysis PowerPoint template
- #dual-tone diagram slide design
About the Product
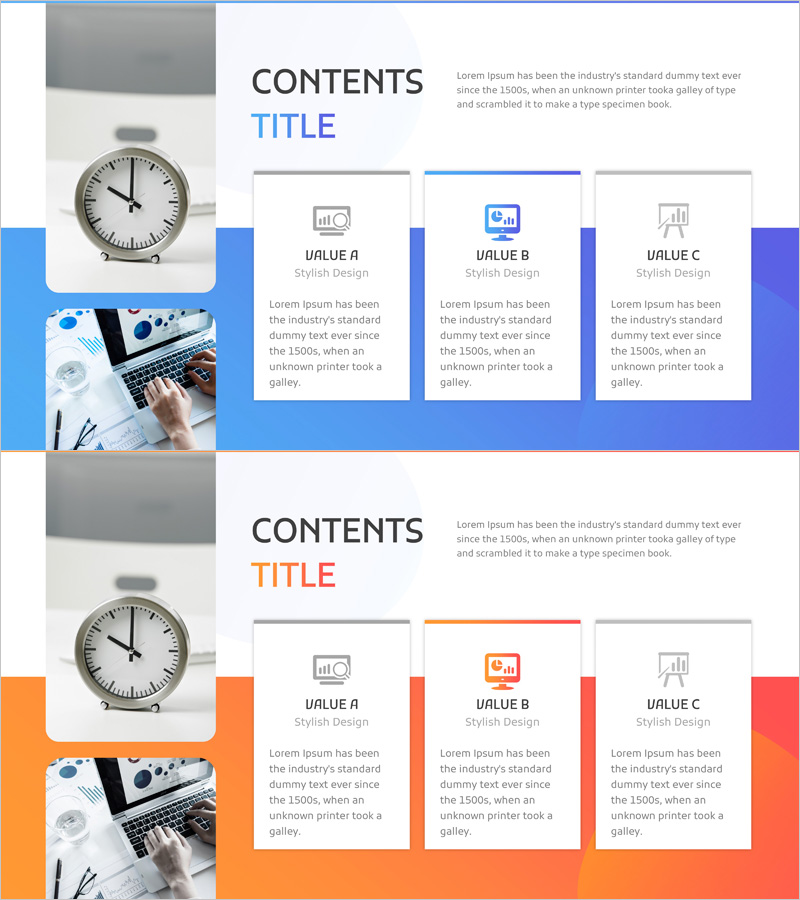
A closed-form diagram PowerPoint slide that presents business vision and goals across three distinct items using blue and orange dual-tone color scheme. The layout features a balanced composition with image area on the left and text content on the right, making it ideal for data analysis presentations, business strategy discussions, and project objective summaries. This 16:9 widescreen format slide deck contains two fully customizable slides ready for immediate use in professional presentations.
Usage Points
-
Main Usage
Visualize three core business elements—vision, objectives, and strategy—using a closed-form diagram structure that enhances audience comprehension. The balanced left-right layout combining imagery with text maximizes information delivery efficiency for data analysis results, project goals, and strategic direction.
-
How to Use
Deploy this slide during the opening phase of presentations to introduce three key business components, or use it to organize data analysis findings across three perspectives such as current status, target goals, and implementation strategy. Easily customize text fields for each item and replace the left-side image to match your presentation context.
-
Recommended For
Data analysts, business strategists, project managers, and marketing professionals presenting business plans, quarterly performance reports, investment proposals, and strategic planning sessions. Particularly effective when comparative analysis across three viewpoints is required.
-
Slide Structure
Two-slide deck with consistent layout: left side features clock and business photography imagery, right side displays the three-item closed diagram. First slide uses blue tone, second slide uses orange tone for visual distinction. Each item includes independent text input fields enabling flexible customization and content adaptation.
Related Products
-

Introduction to the Transportation Program – Efficient Cluster Diagram
#Product/Service Introduction #Business Vision and Strategy #Diagram
-

Business Objectives Square Diagram – Effective Strategy Formulation
#Product/Service Introduction #Business Vision and Strategy #Diagram
-

Introducing the Business Investment Program – Cluster and Closed Diagram
#Product/Service Introduction #Business Vision and Strategy #Diagram
-

Ringer Shape Subdivided Column Graph for Global Trade Business Objectives
#Product/Service Introduction #Business Vision and Strategy #Diagram
