Data Analysis Illustration Template Section Slide 03 – A Powerful Tool for Visual Communication
RJ0400063_20
- Last Update 06/04/2025
- File Size 0.7MB
- # of Slides 2
- File Format PPTX
- Slide Ratio 16:9
- Color
Keywords
About the Product
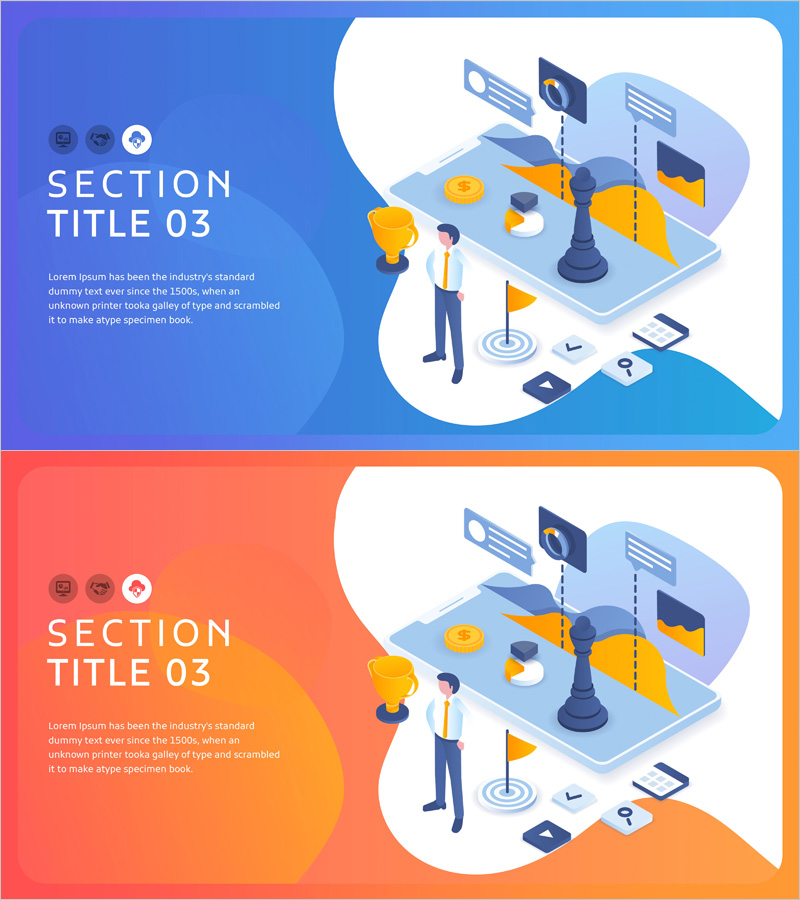
A section divider PowerPoint slide set featuring data analysis themes with blue and orange dual-tone backgrounds and business illustrations. The left side contains 'SECTION TITLE 03' text area and description space, while the right side displays data-related icons (trophy, chess piece, chart, coins, documents) and a businessman illustration. Provided in 16:9 widescreen PPTX format with two color variations, ready for immediate editing. Ideal for section breaks in reports, proposals, and business plans.
Usage Points
-
Main Usage
Serves as a section opening page for reports, proposals, and business plans. Emphasizes visual separation of data analysis, strategy, and performance sections while capturing audience attention at section transitions.
-
How to Use
Edit the 'SECTION TITLE' text and description on the left side with your section name and content. Choose between blue or orange background versions to match your document's tone, and place at section transition points.
-
Recommended For
Ideal for executives, analytics teams, and marketing professionals creating data-driven reports and proposals. Particularly recommended for market analysis, performance review, and strategy sections, as well as investor presentations and executive meetings.
-
Slide Structure
2-slide set with each slide divided into left text area (title and description) and right illustration area. Blue and orange tone backgrounds provided separately, allowing color variation across sections for visual diversity.
Related Products
-

Logistics Business Plan Template Cover
#Slide Type #Section Cover
-

Modern Simple Business Plan Template Section Slide
#Slide Type #Section Cover
-

Asset Management Business Plan Template Section Slide – Infused with Professionalism and Trust
#Slide Type #Section Cover
-

Chess Themed Business Strategy Template Section Slide
#Slide Type #Section Cover
