Smart Work PowerPoint Template – Sleek Design for IT/Computer Processes
J0400026
- Last Update 12/30/2024
- File Size 12.7MB
- # of Slides 35
- File Format PPTX
- Slide Ratio 16:9
- Color
Slide Preview


Keywords
About the Product
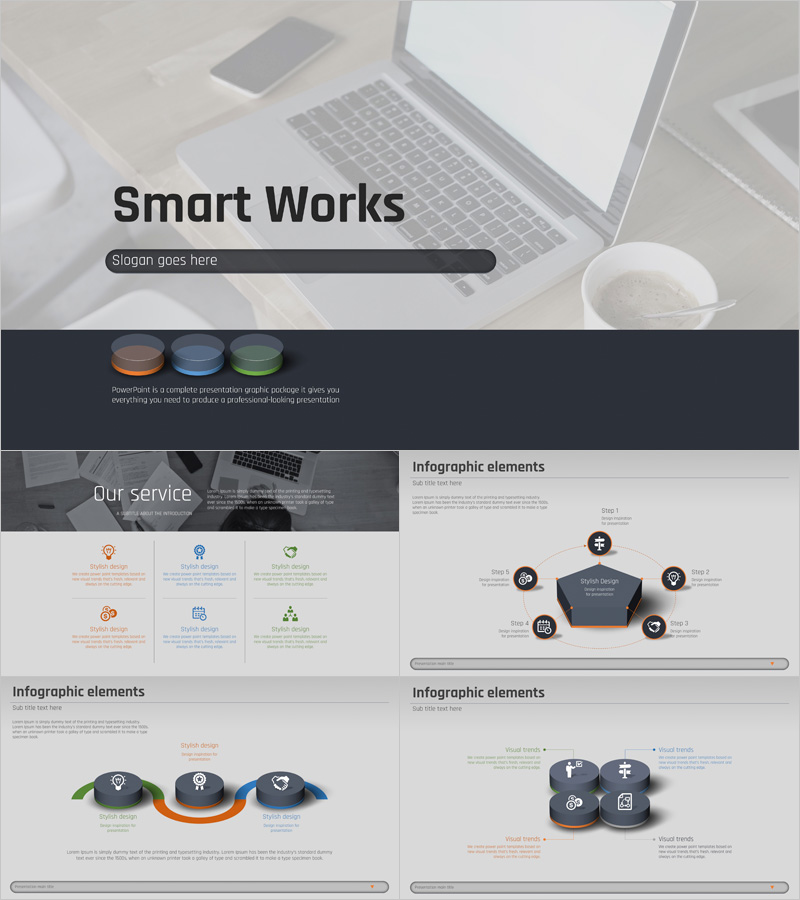
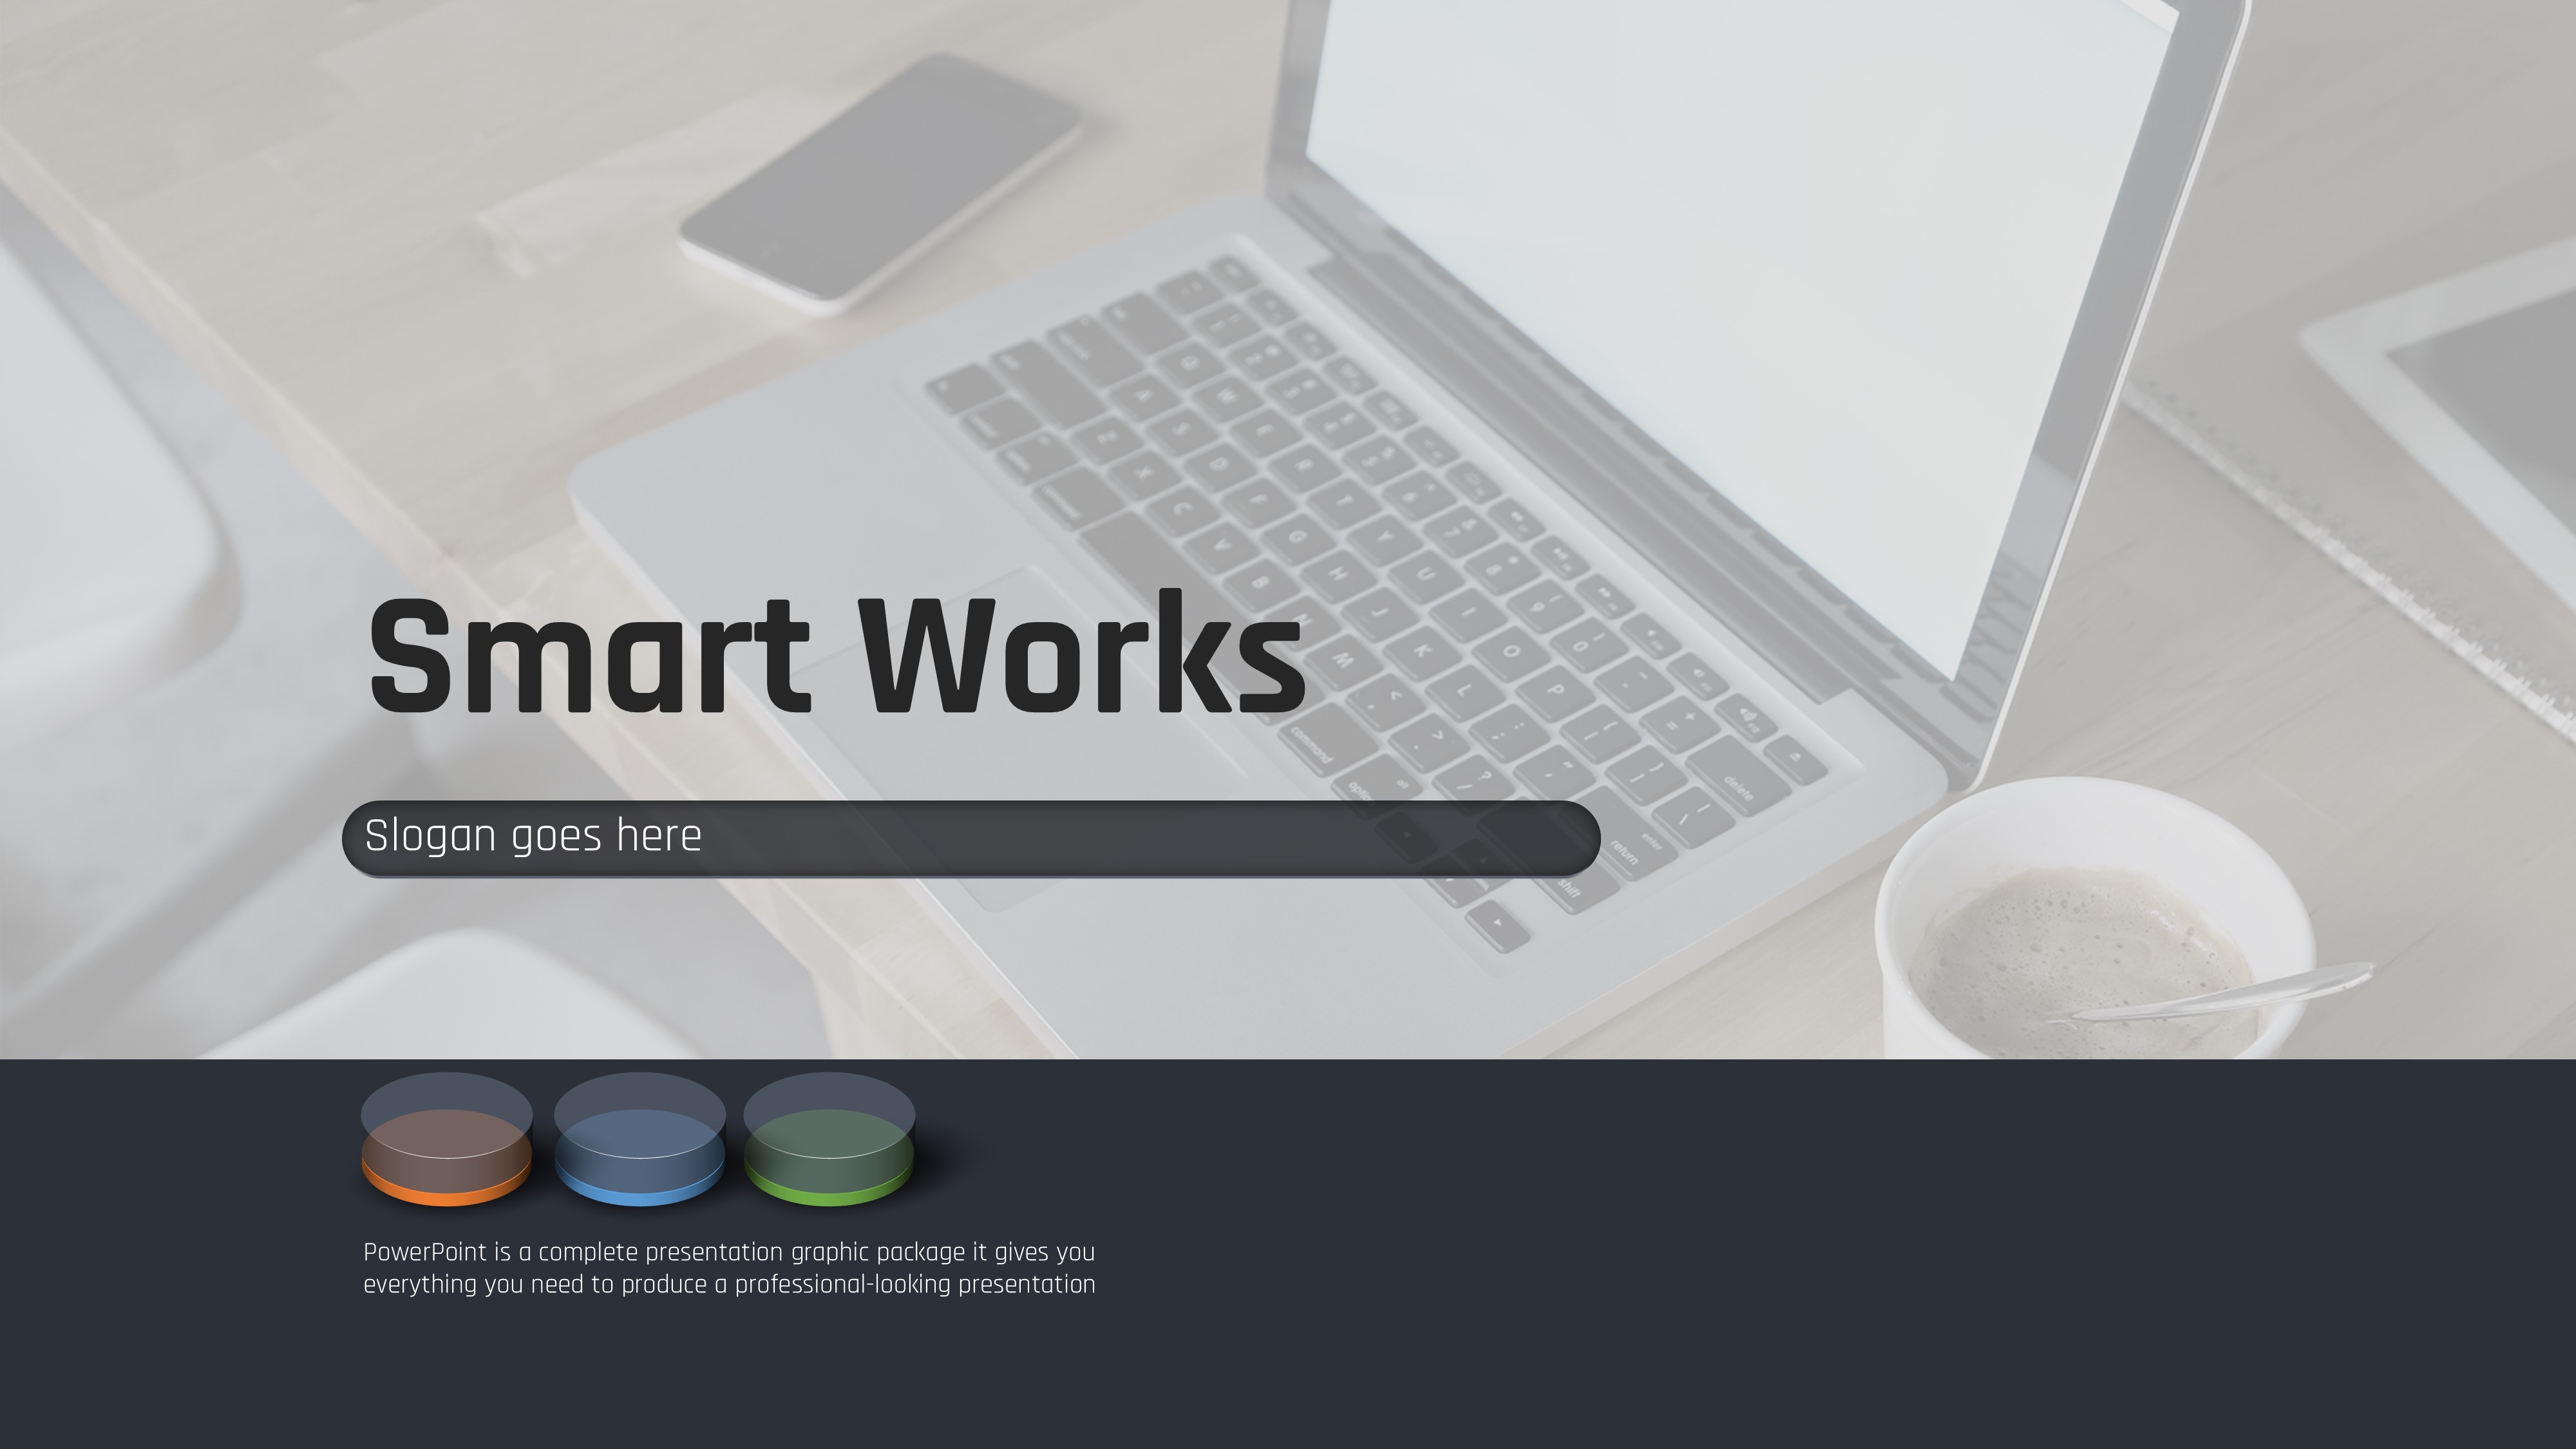
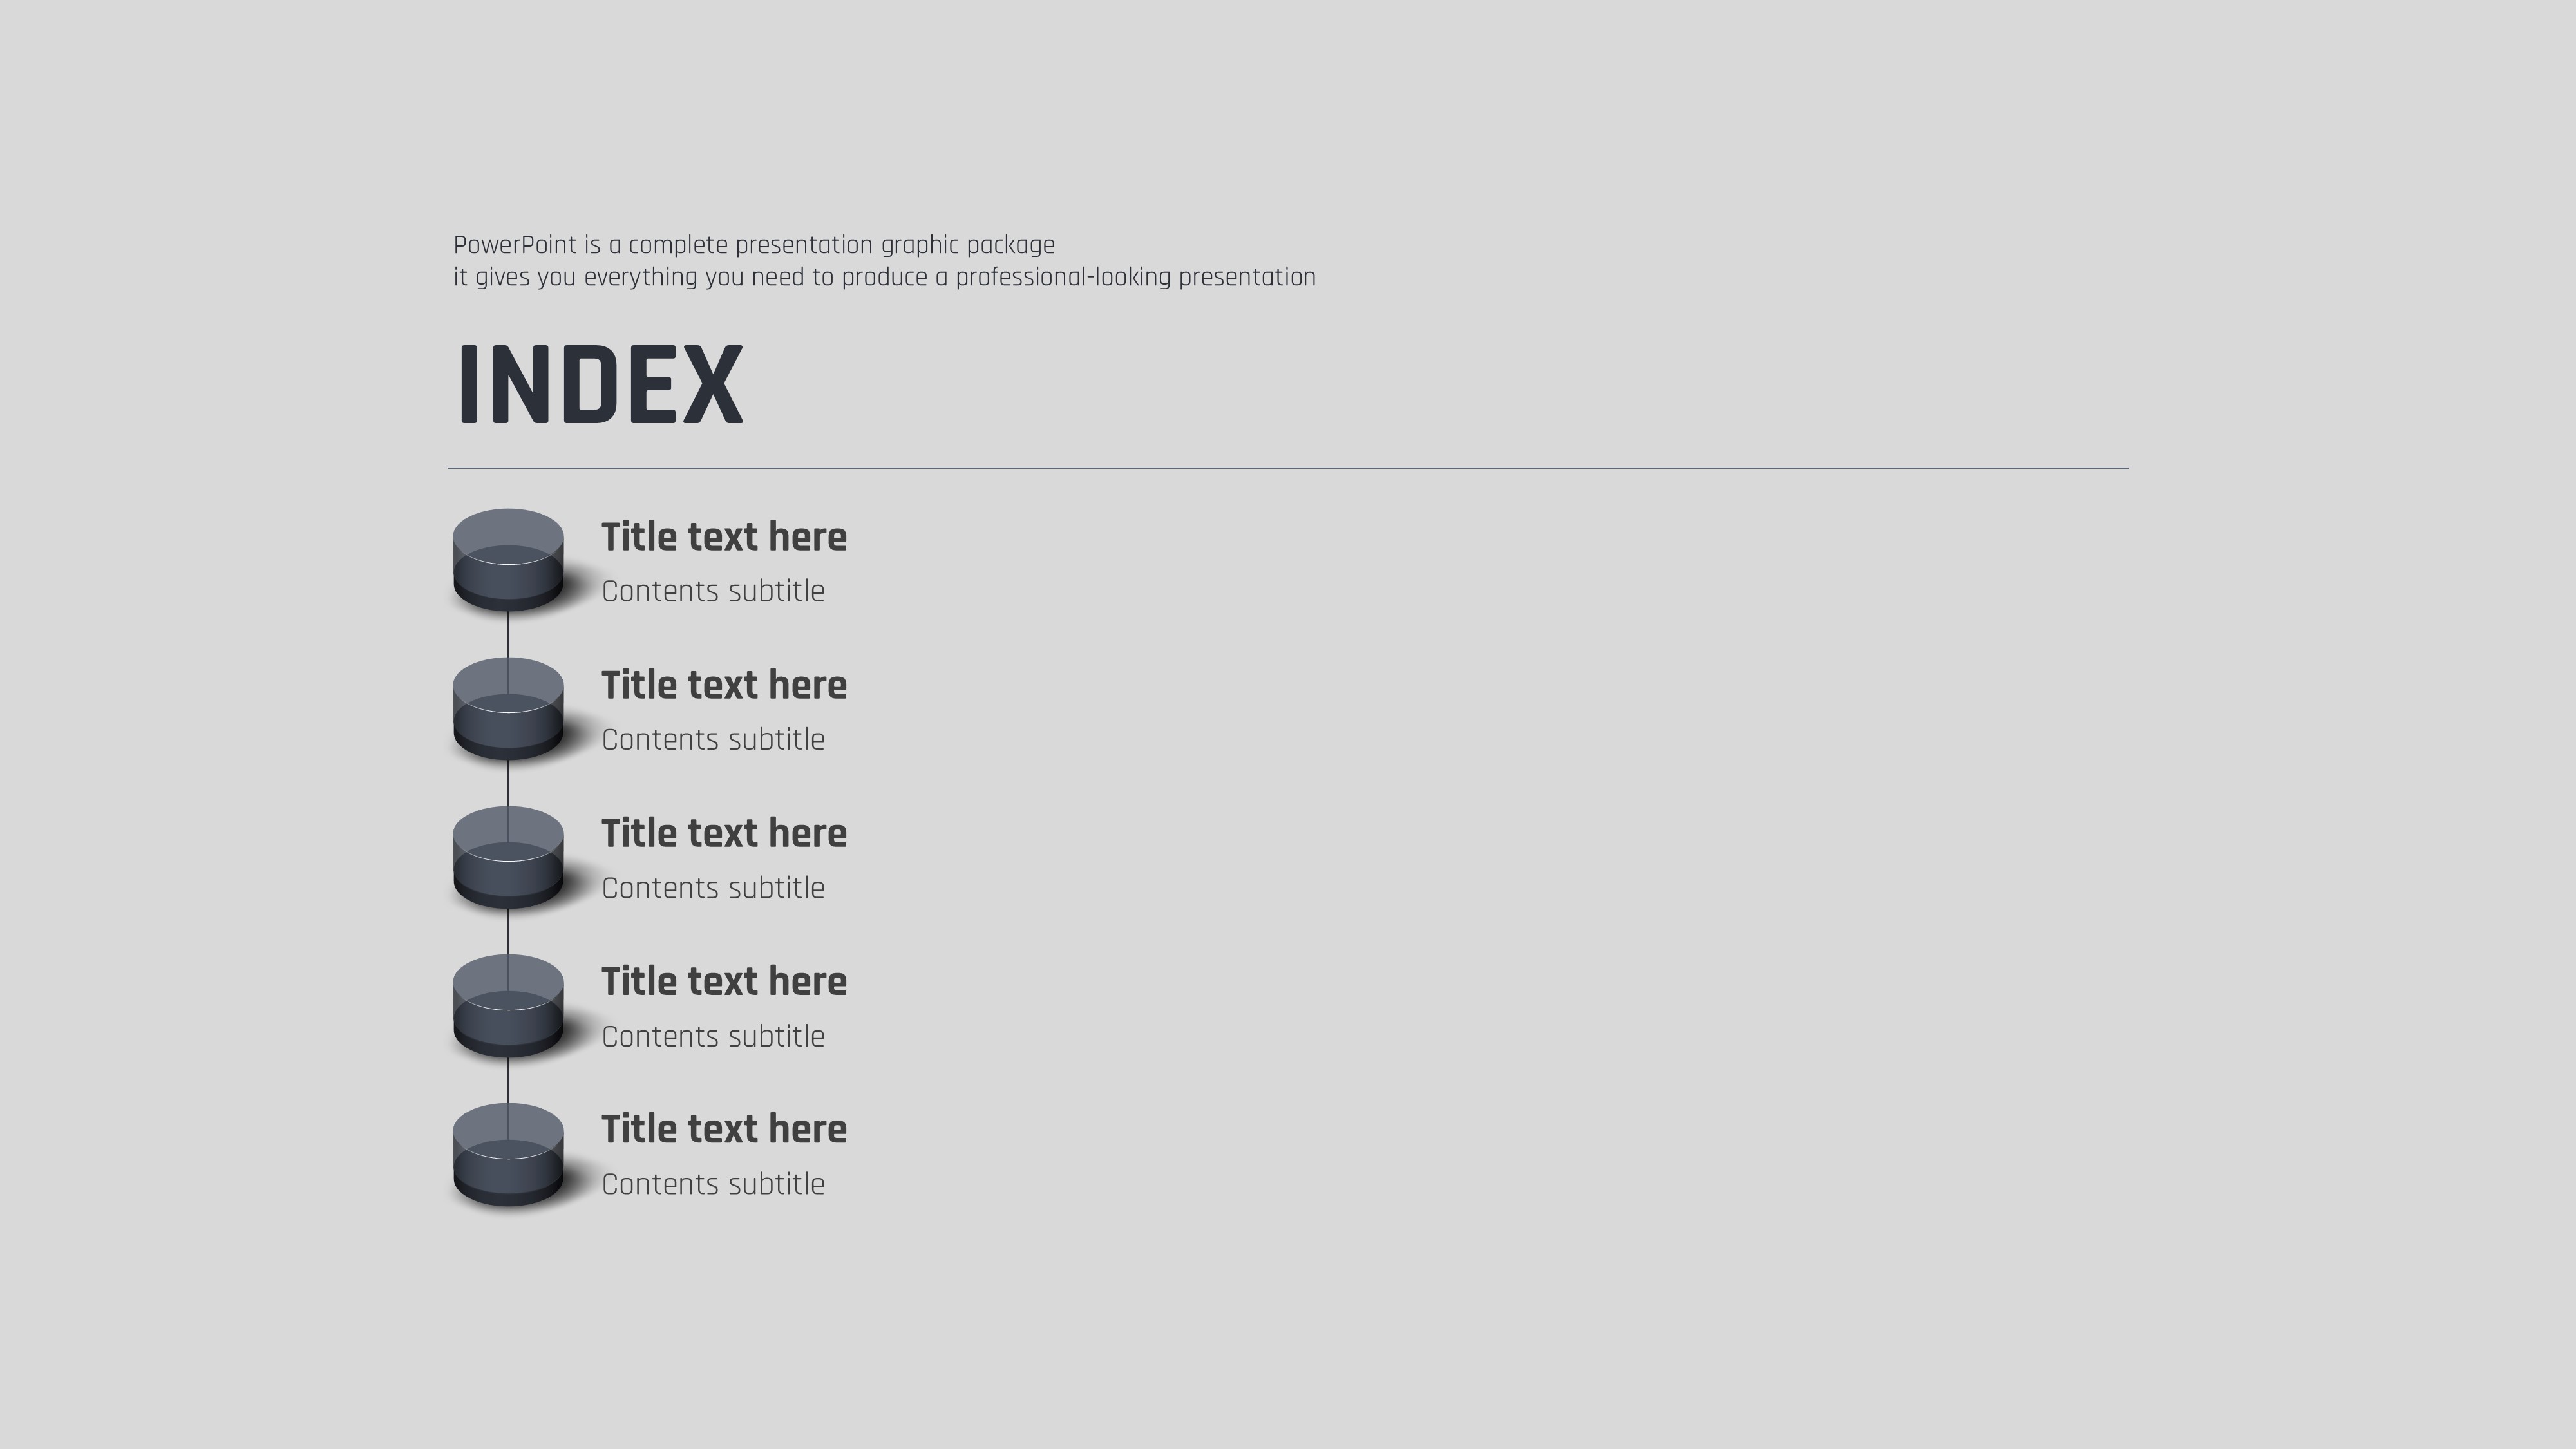
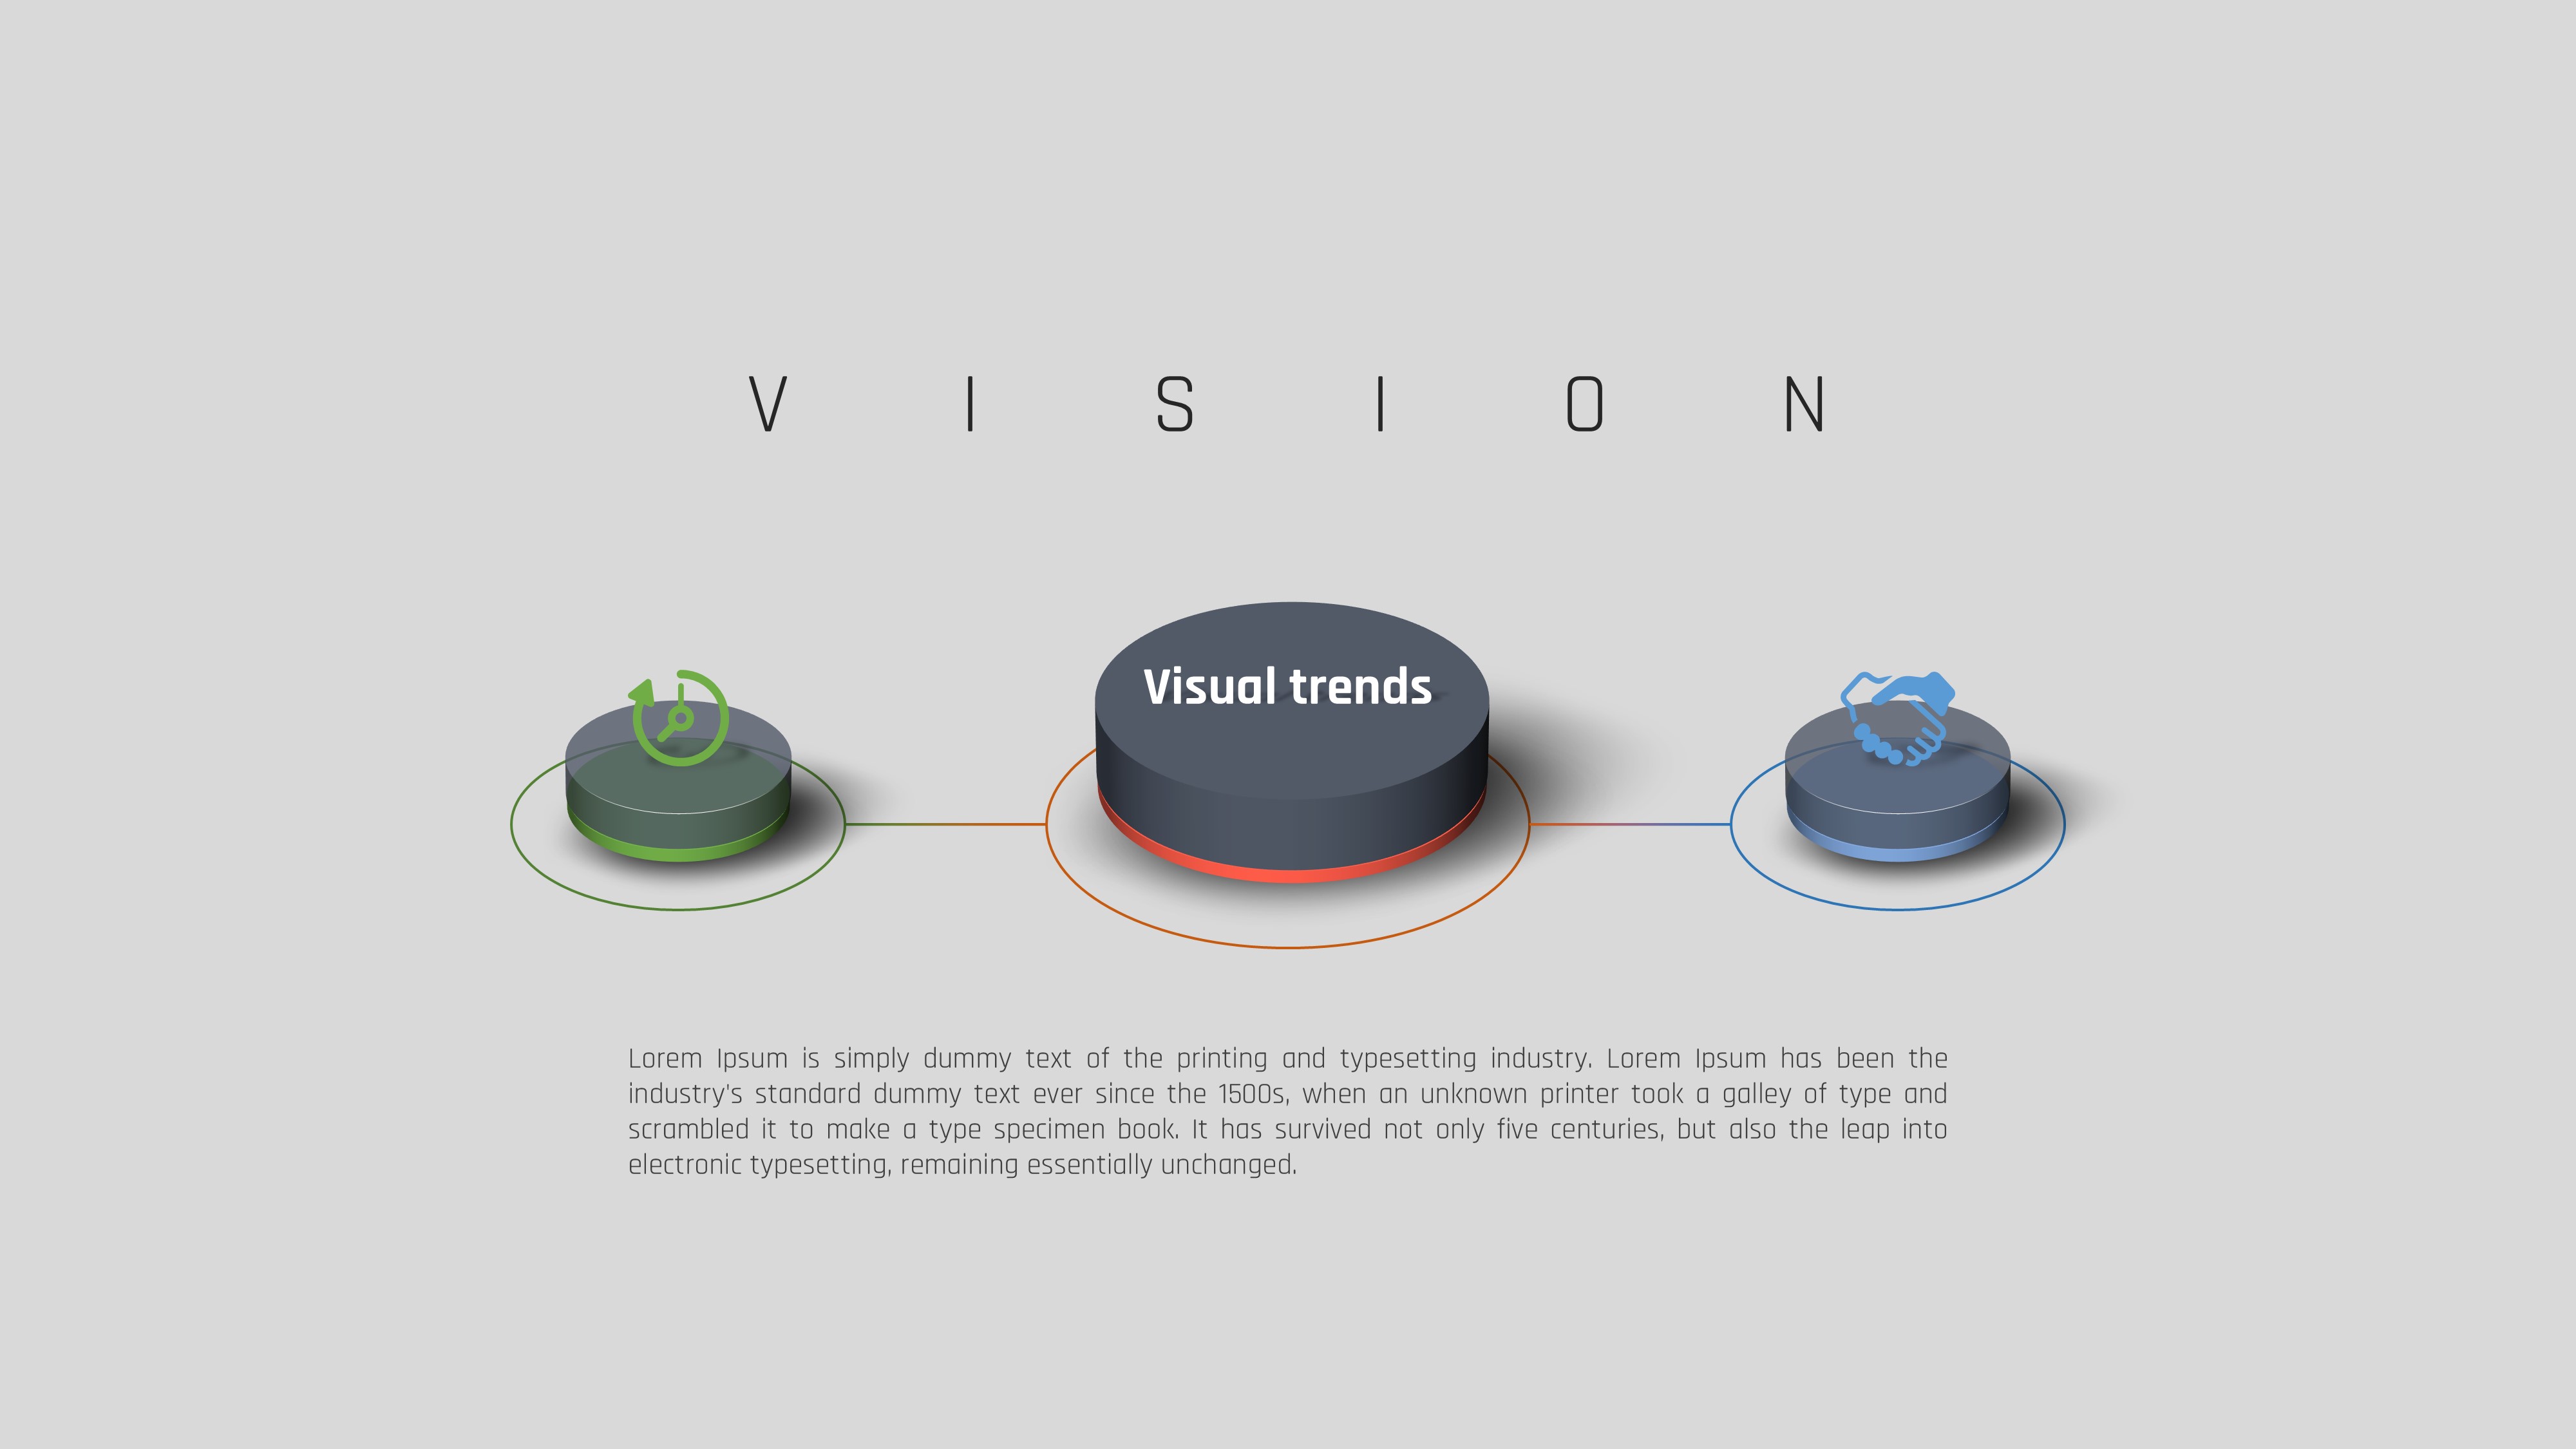
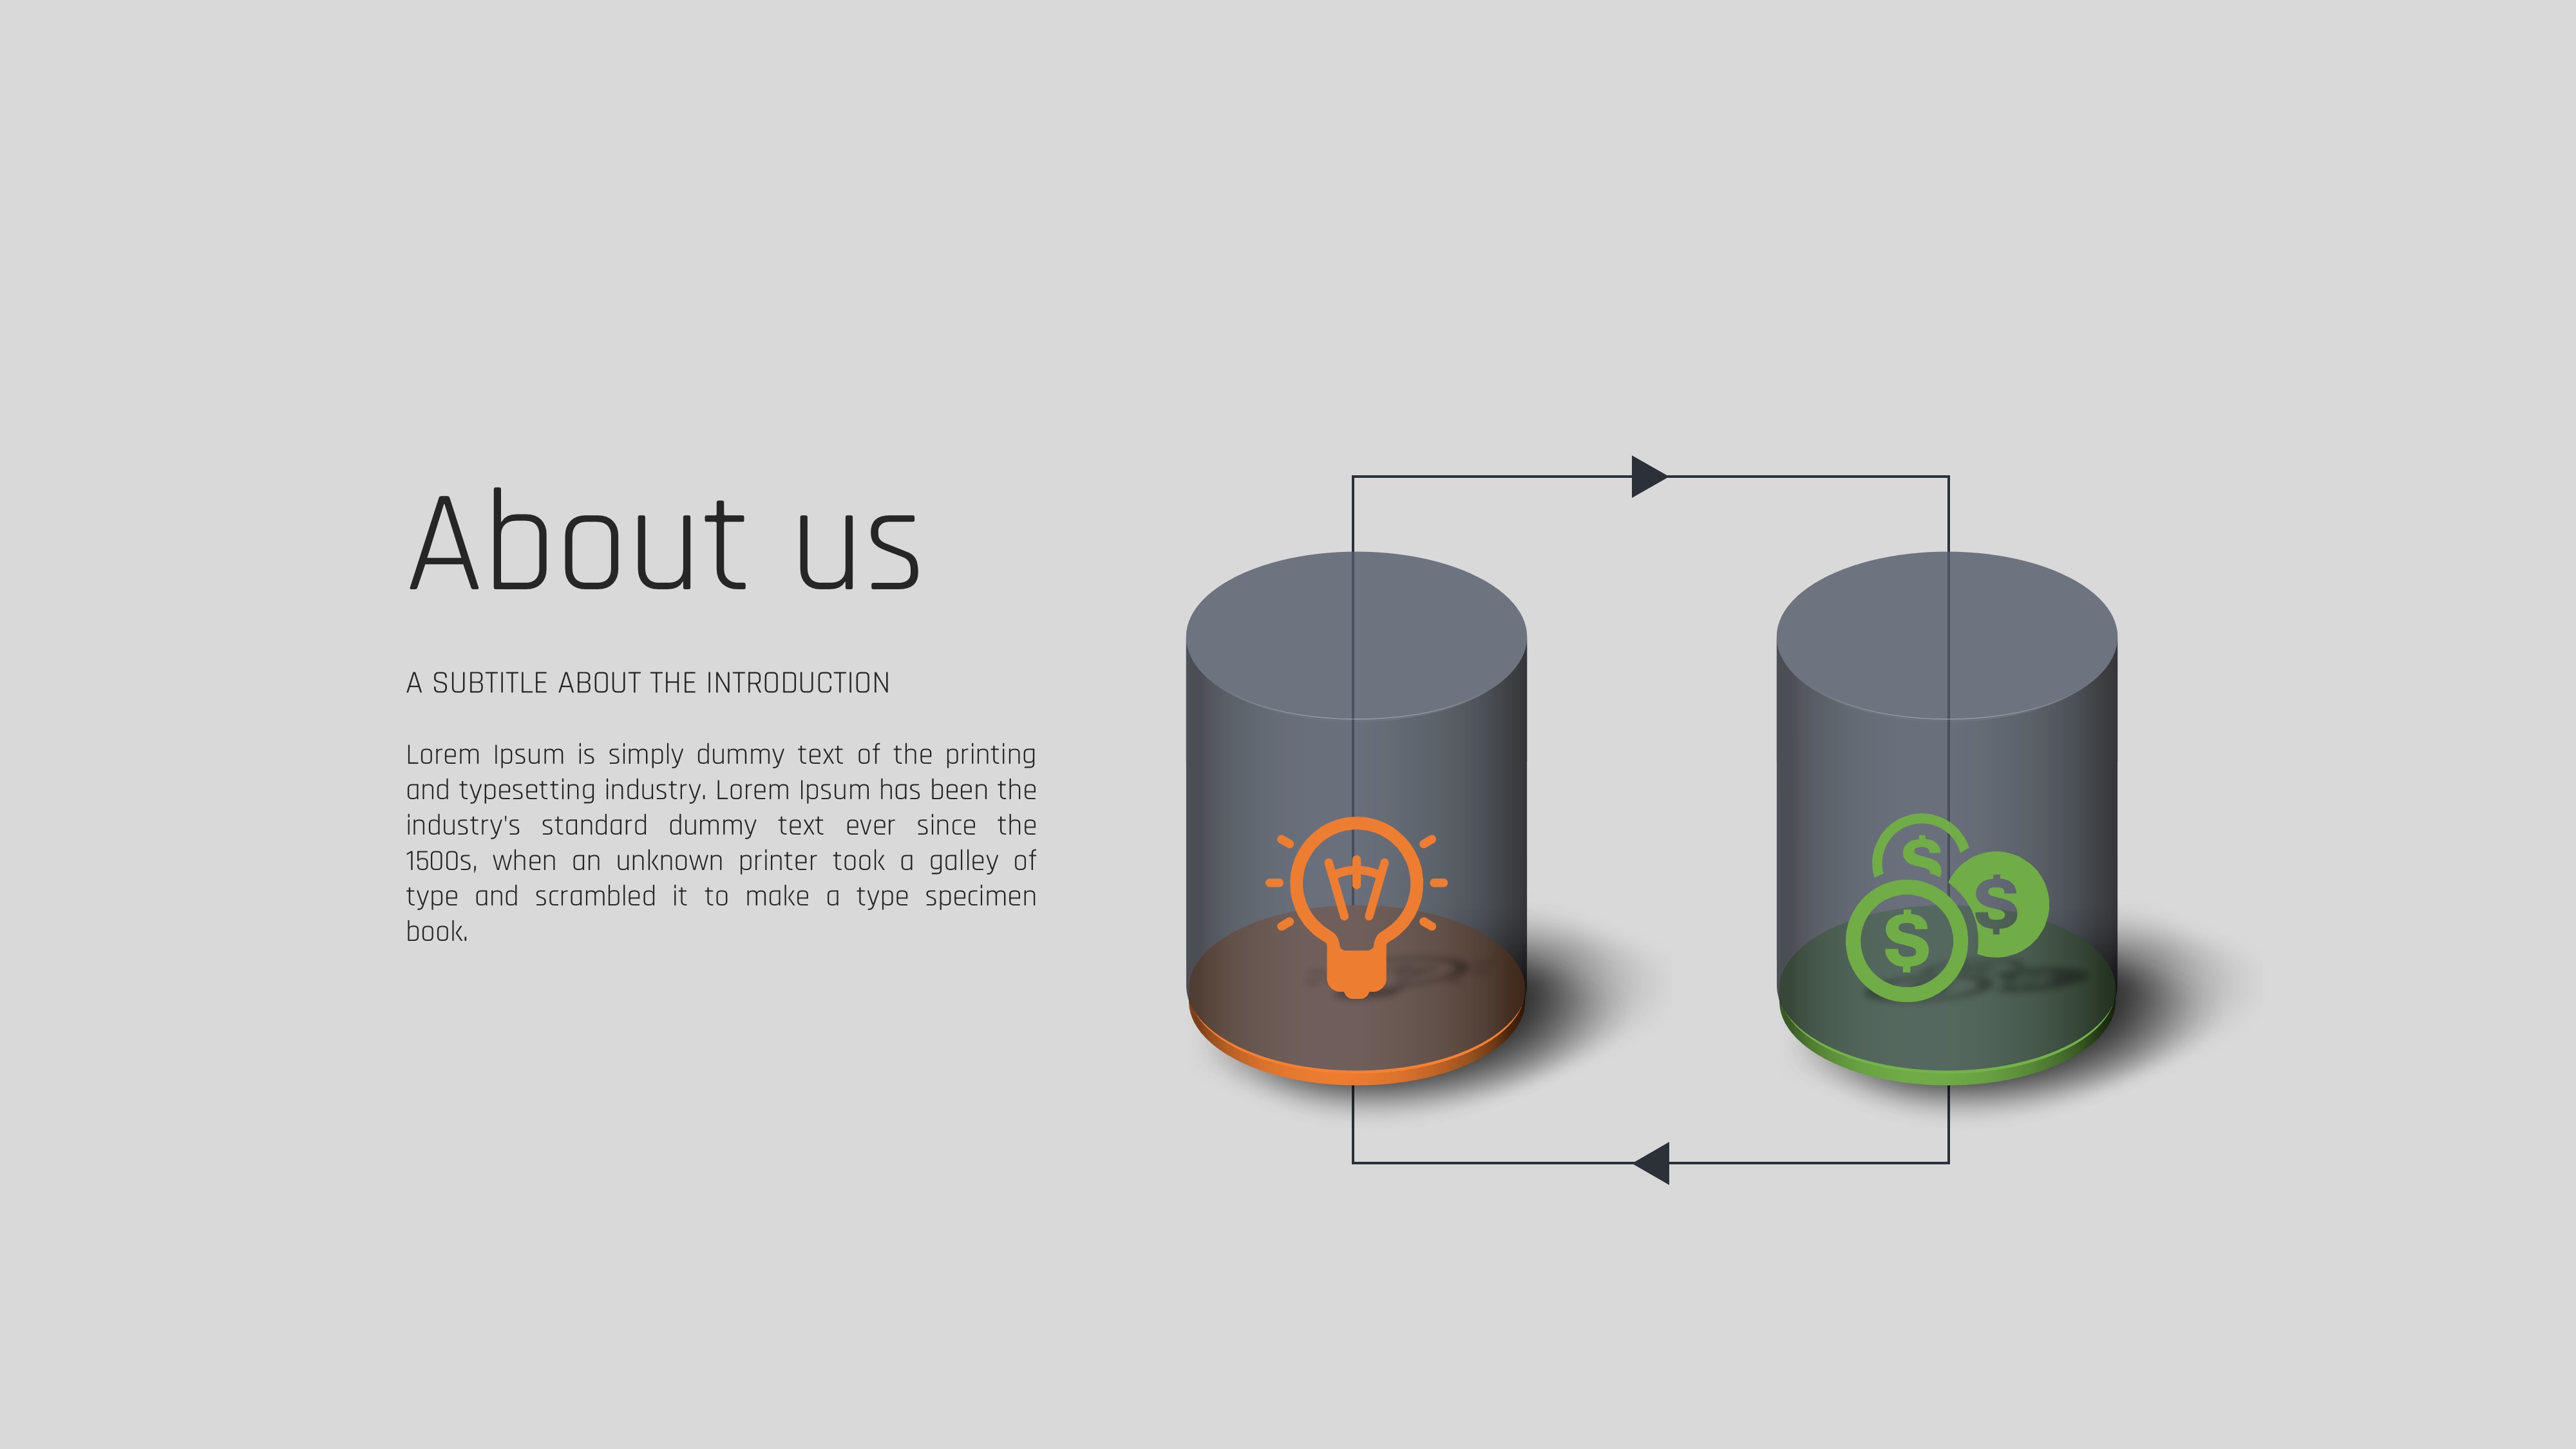
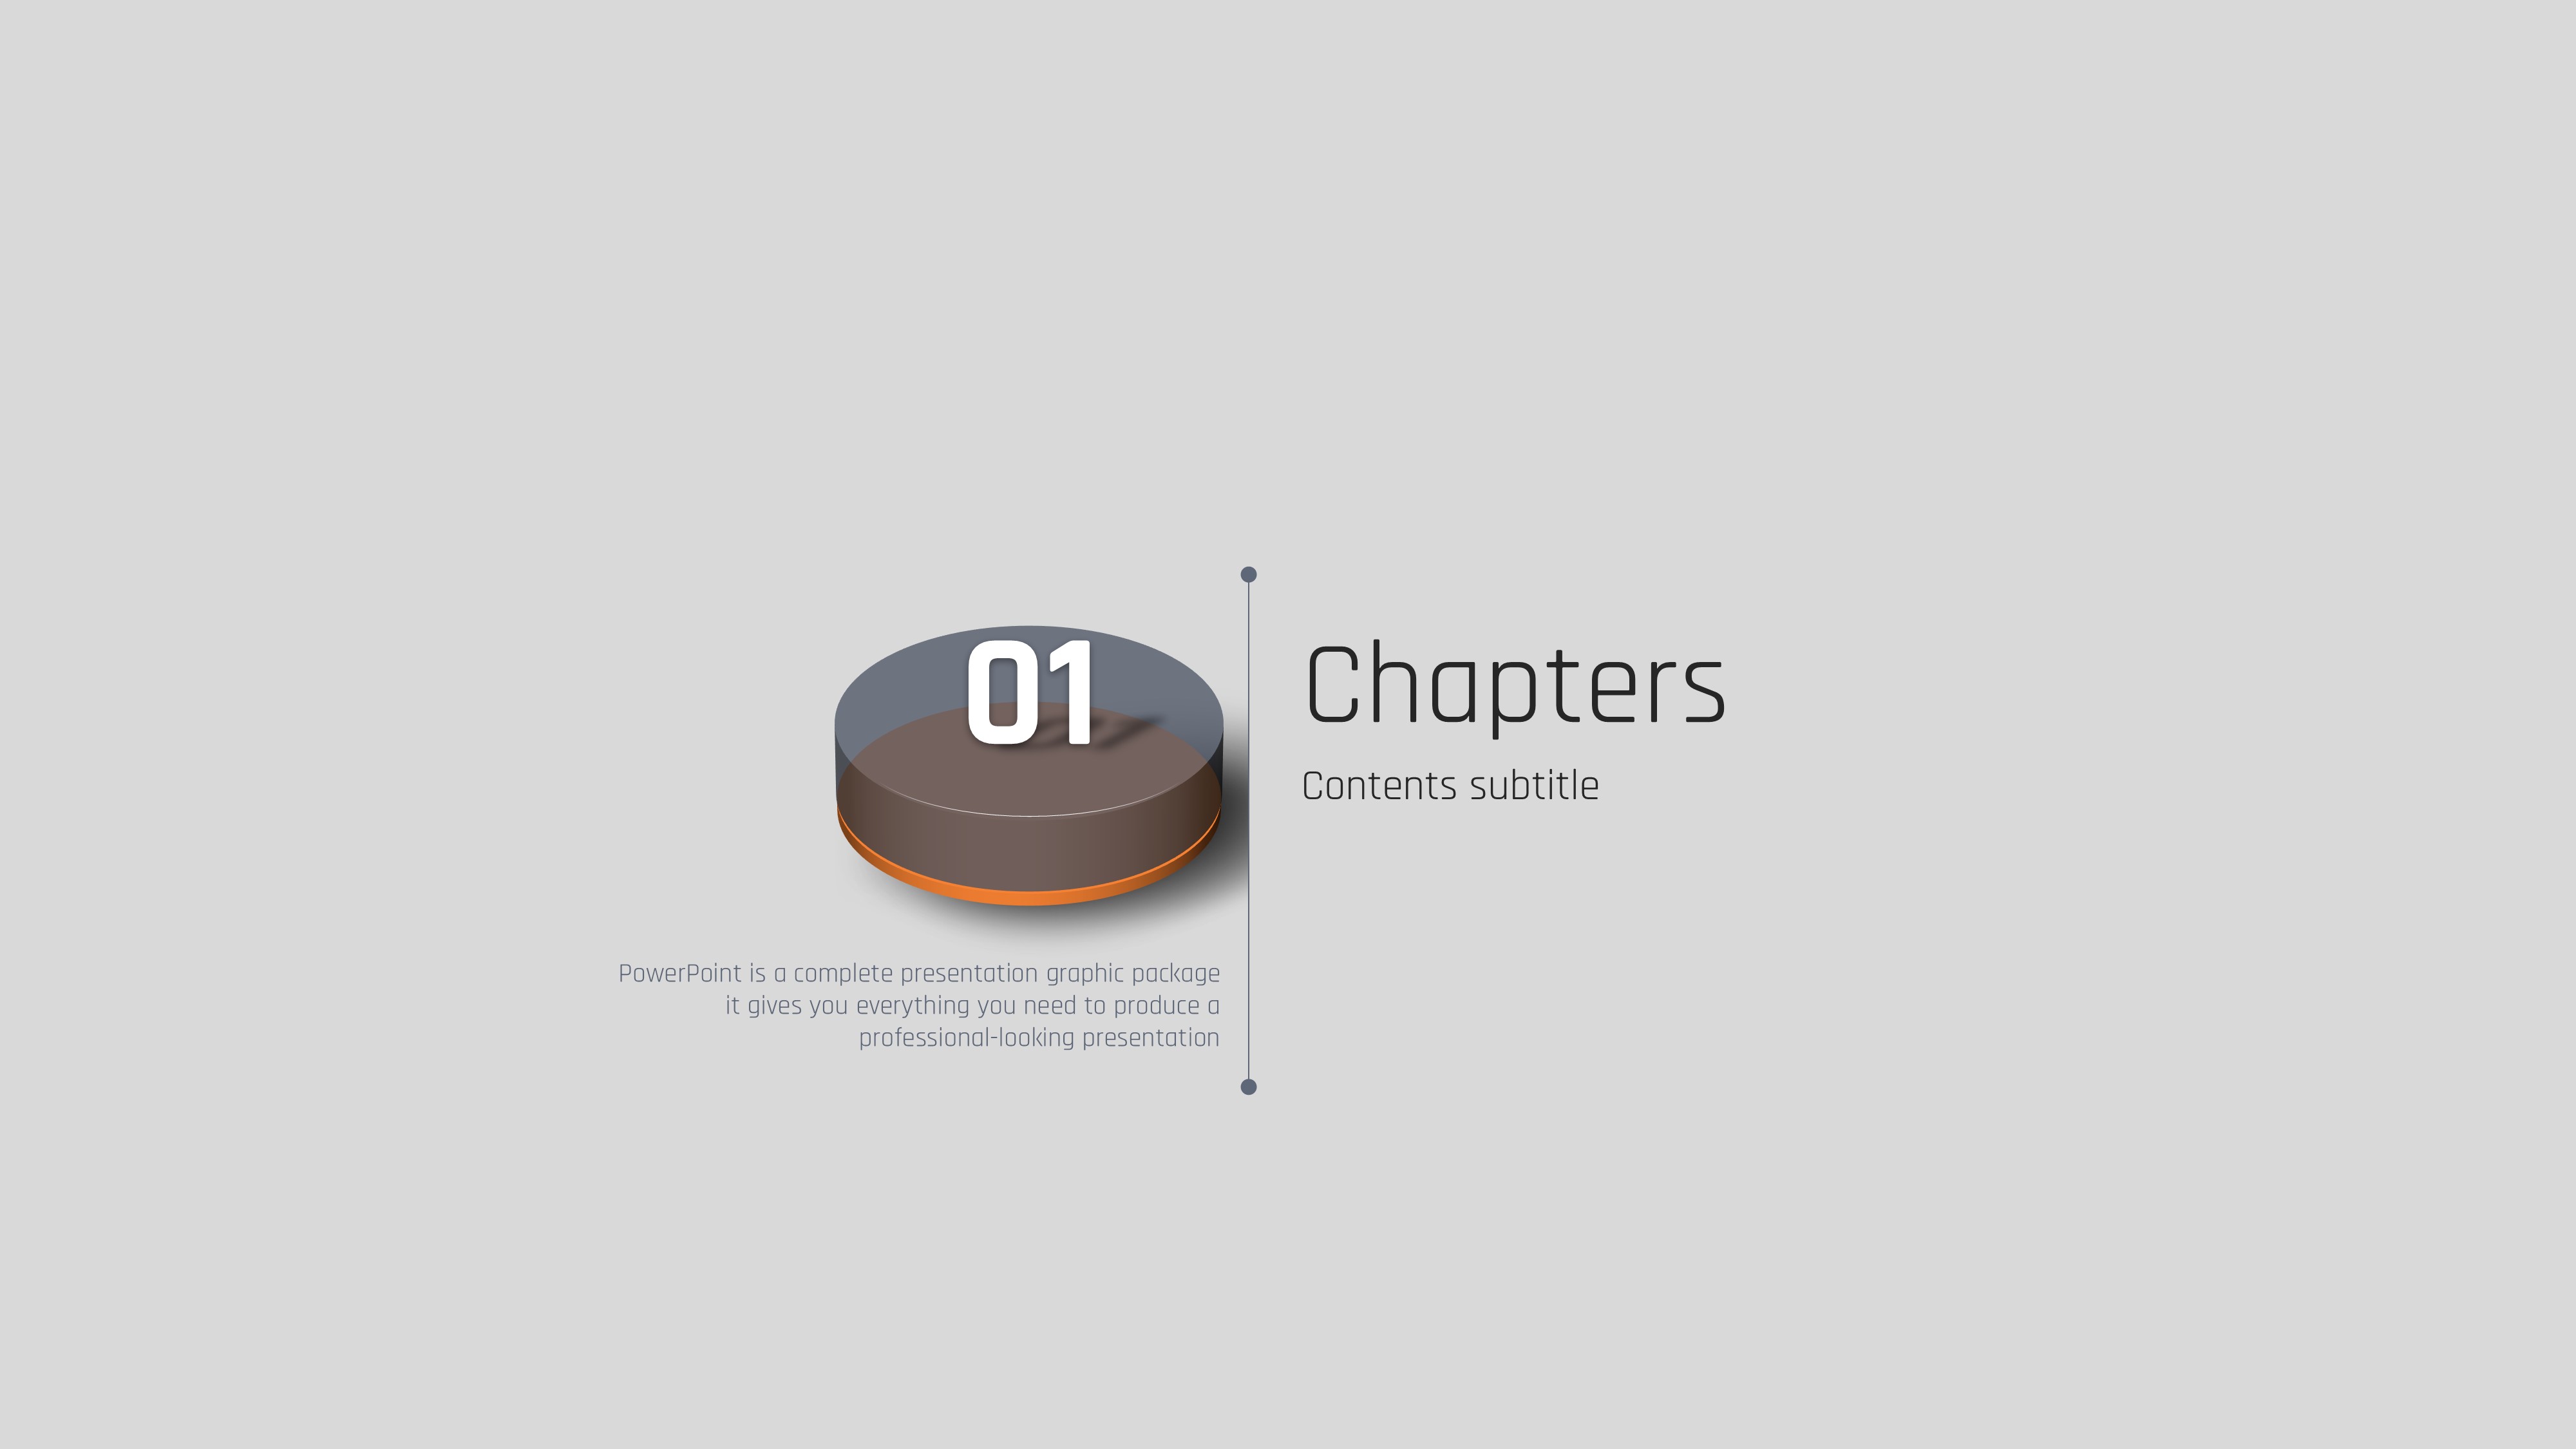
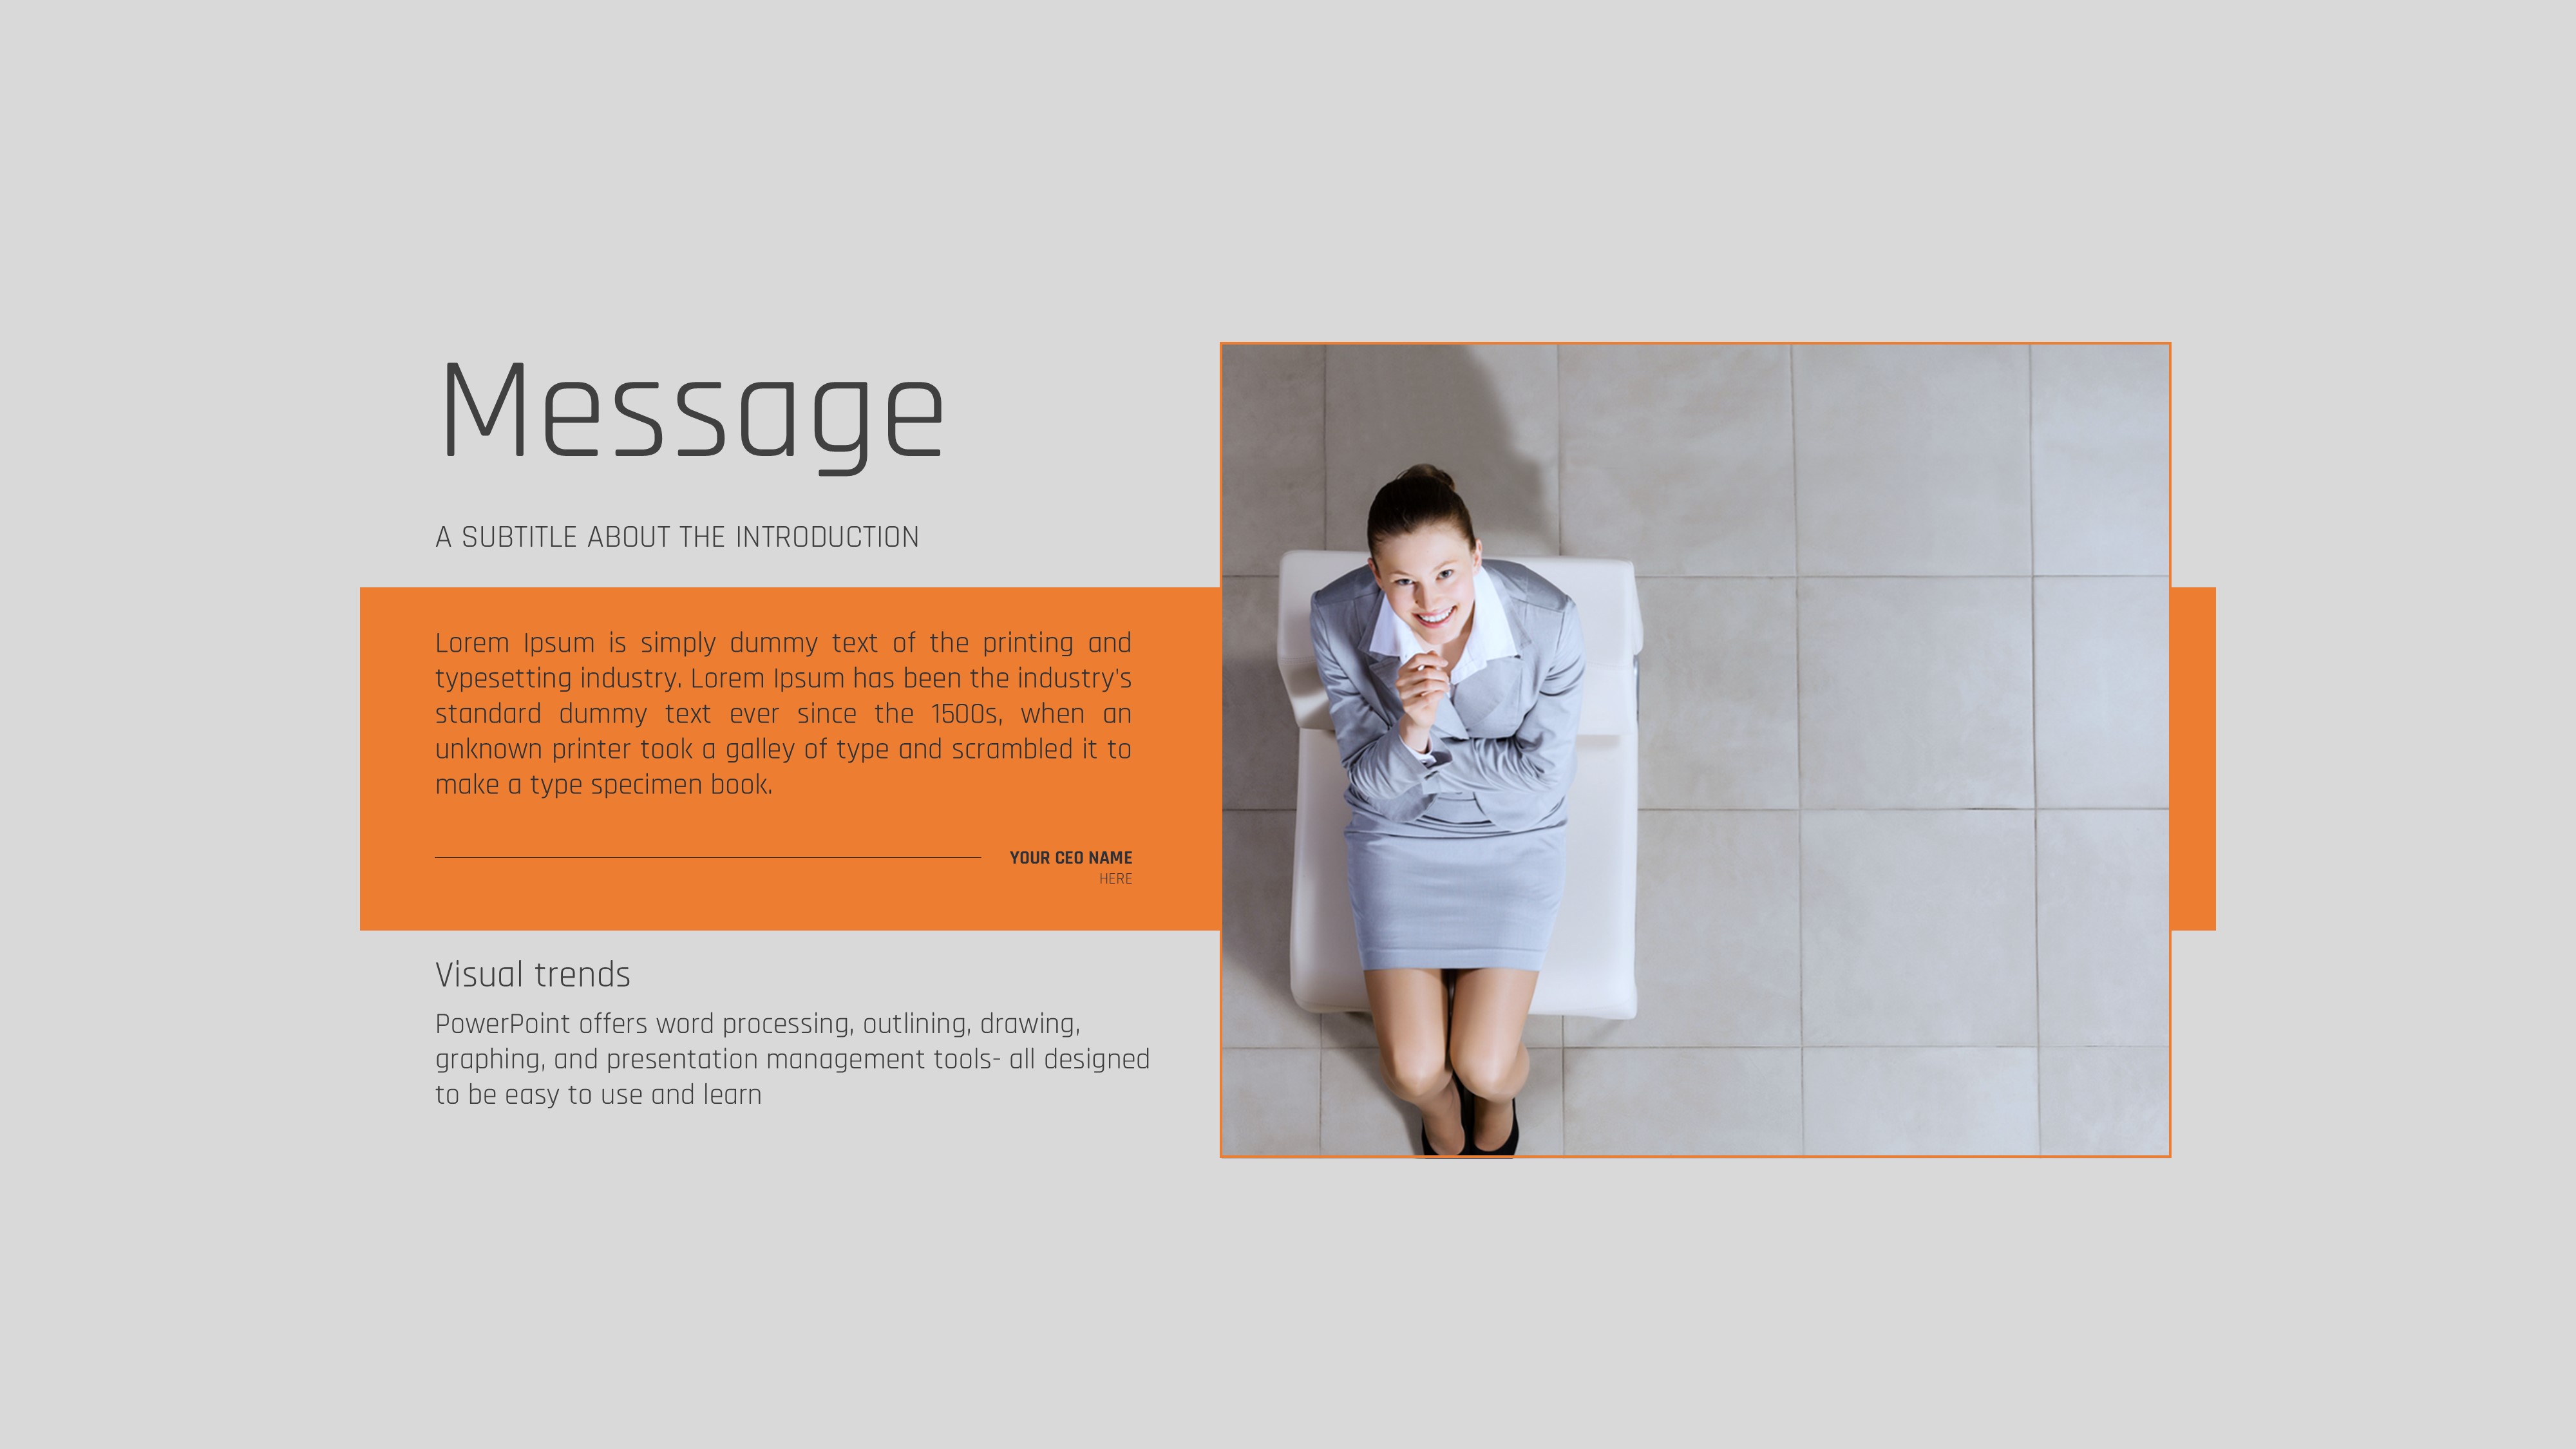
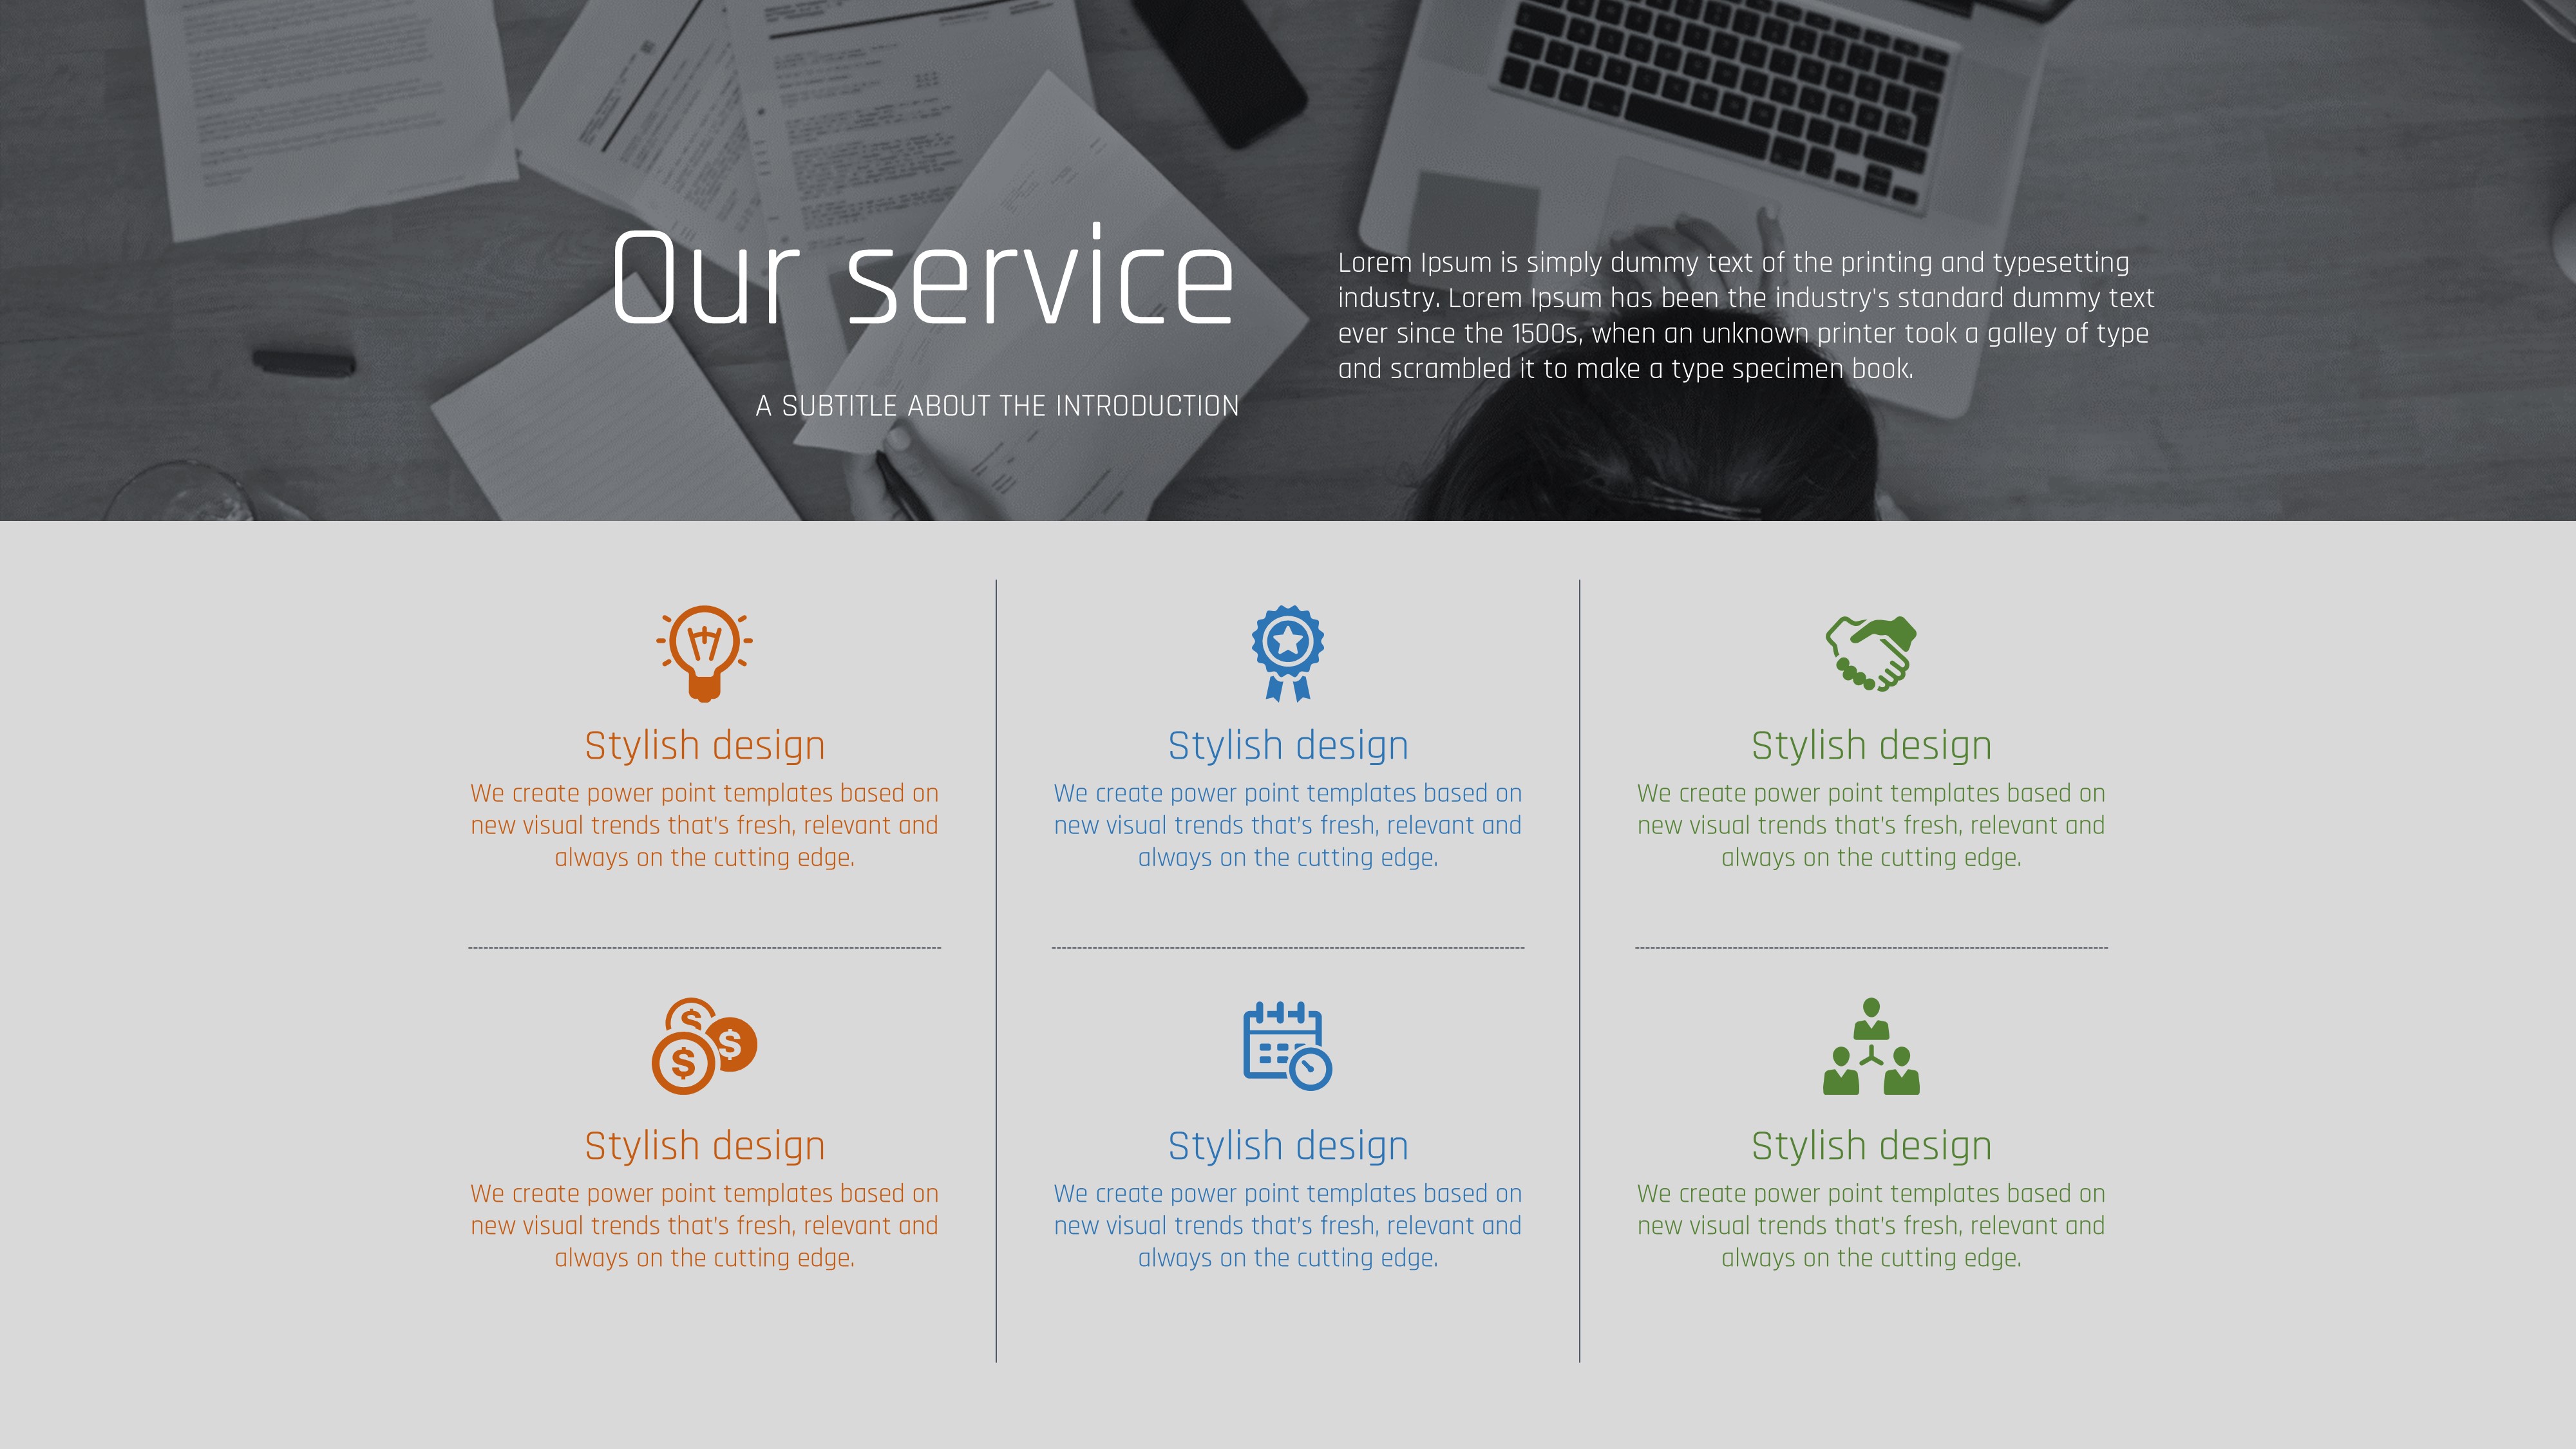
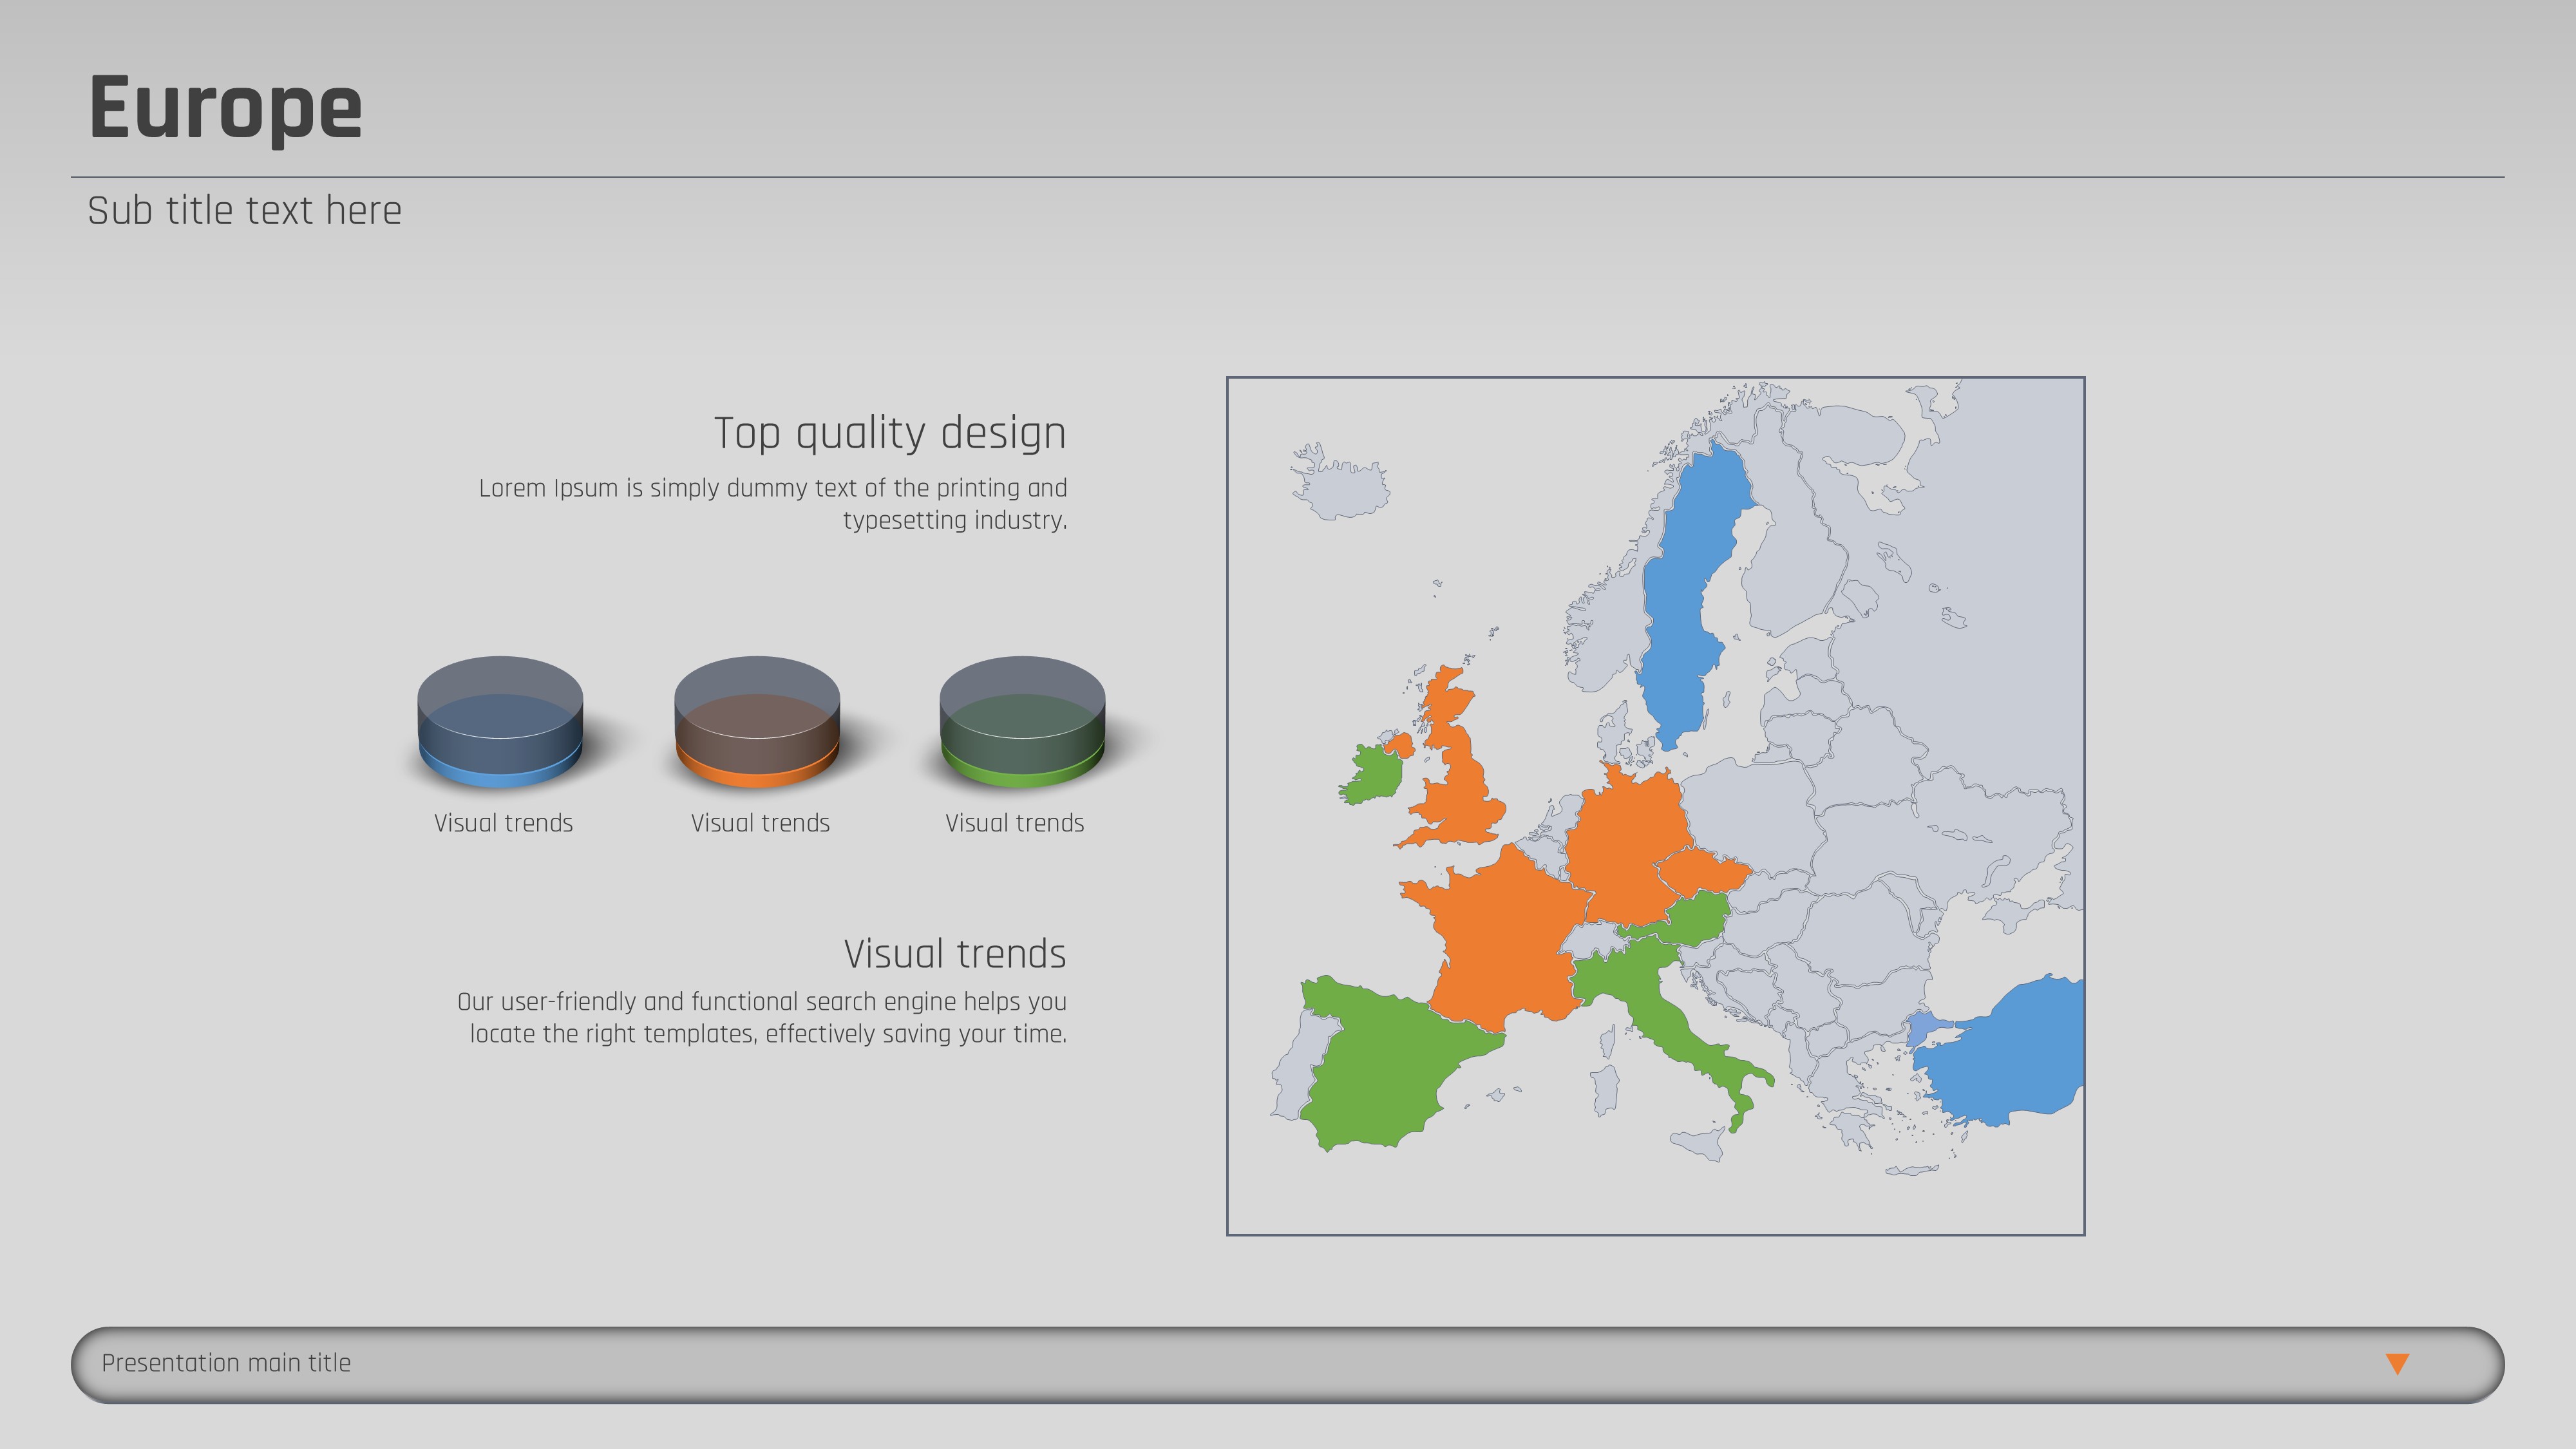
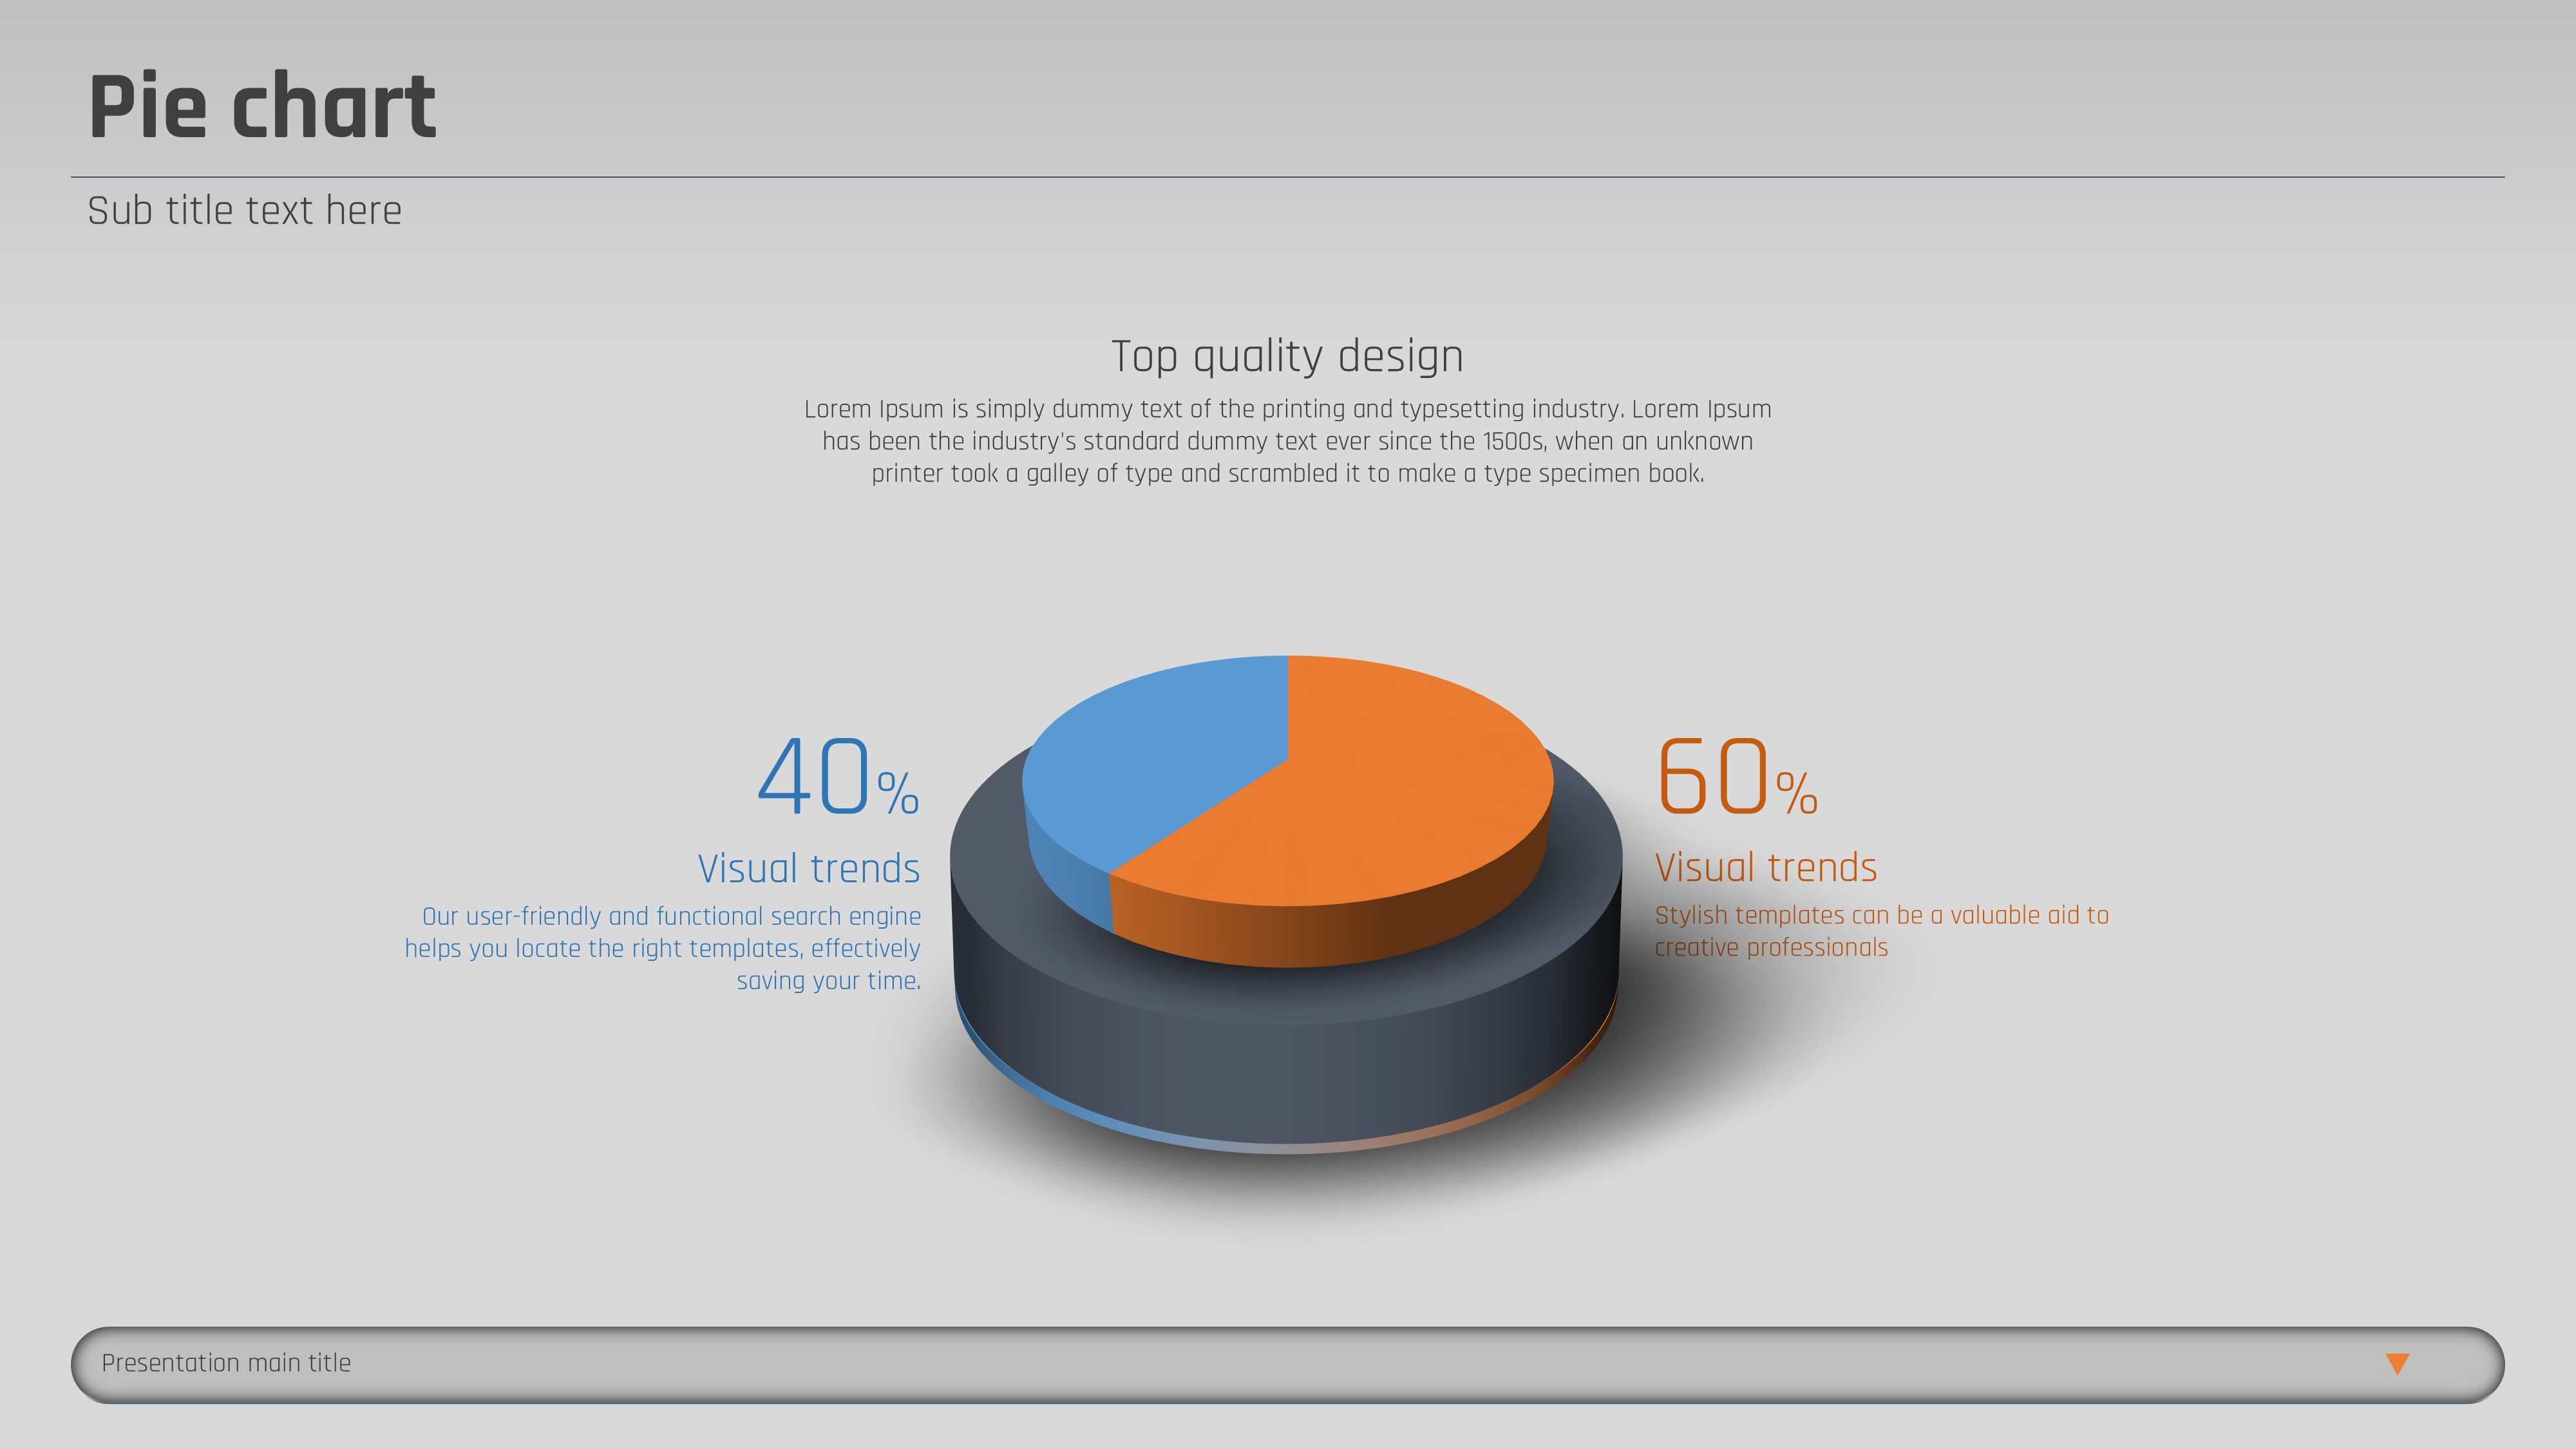
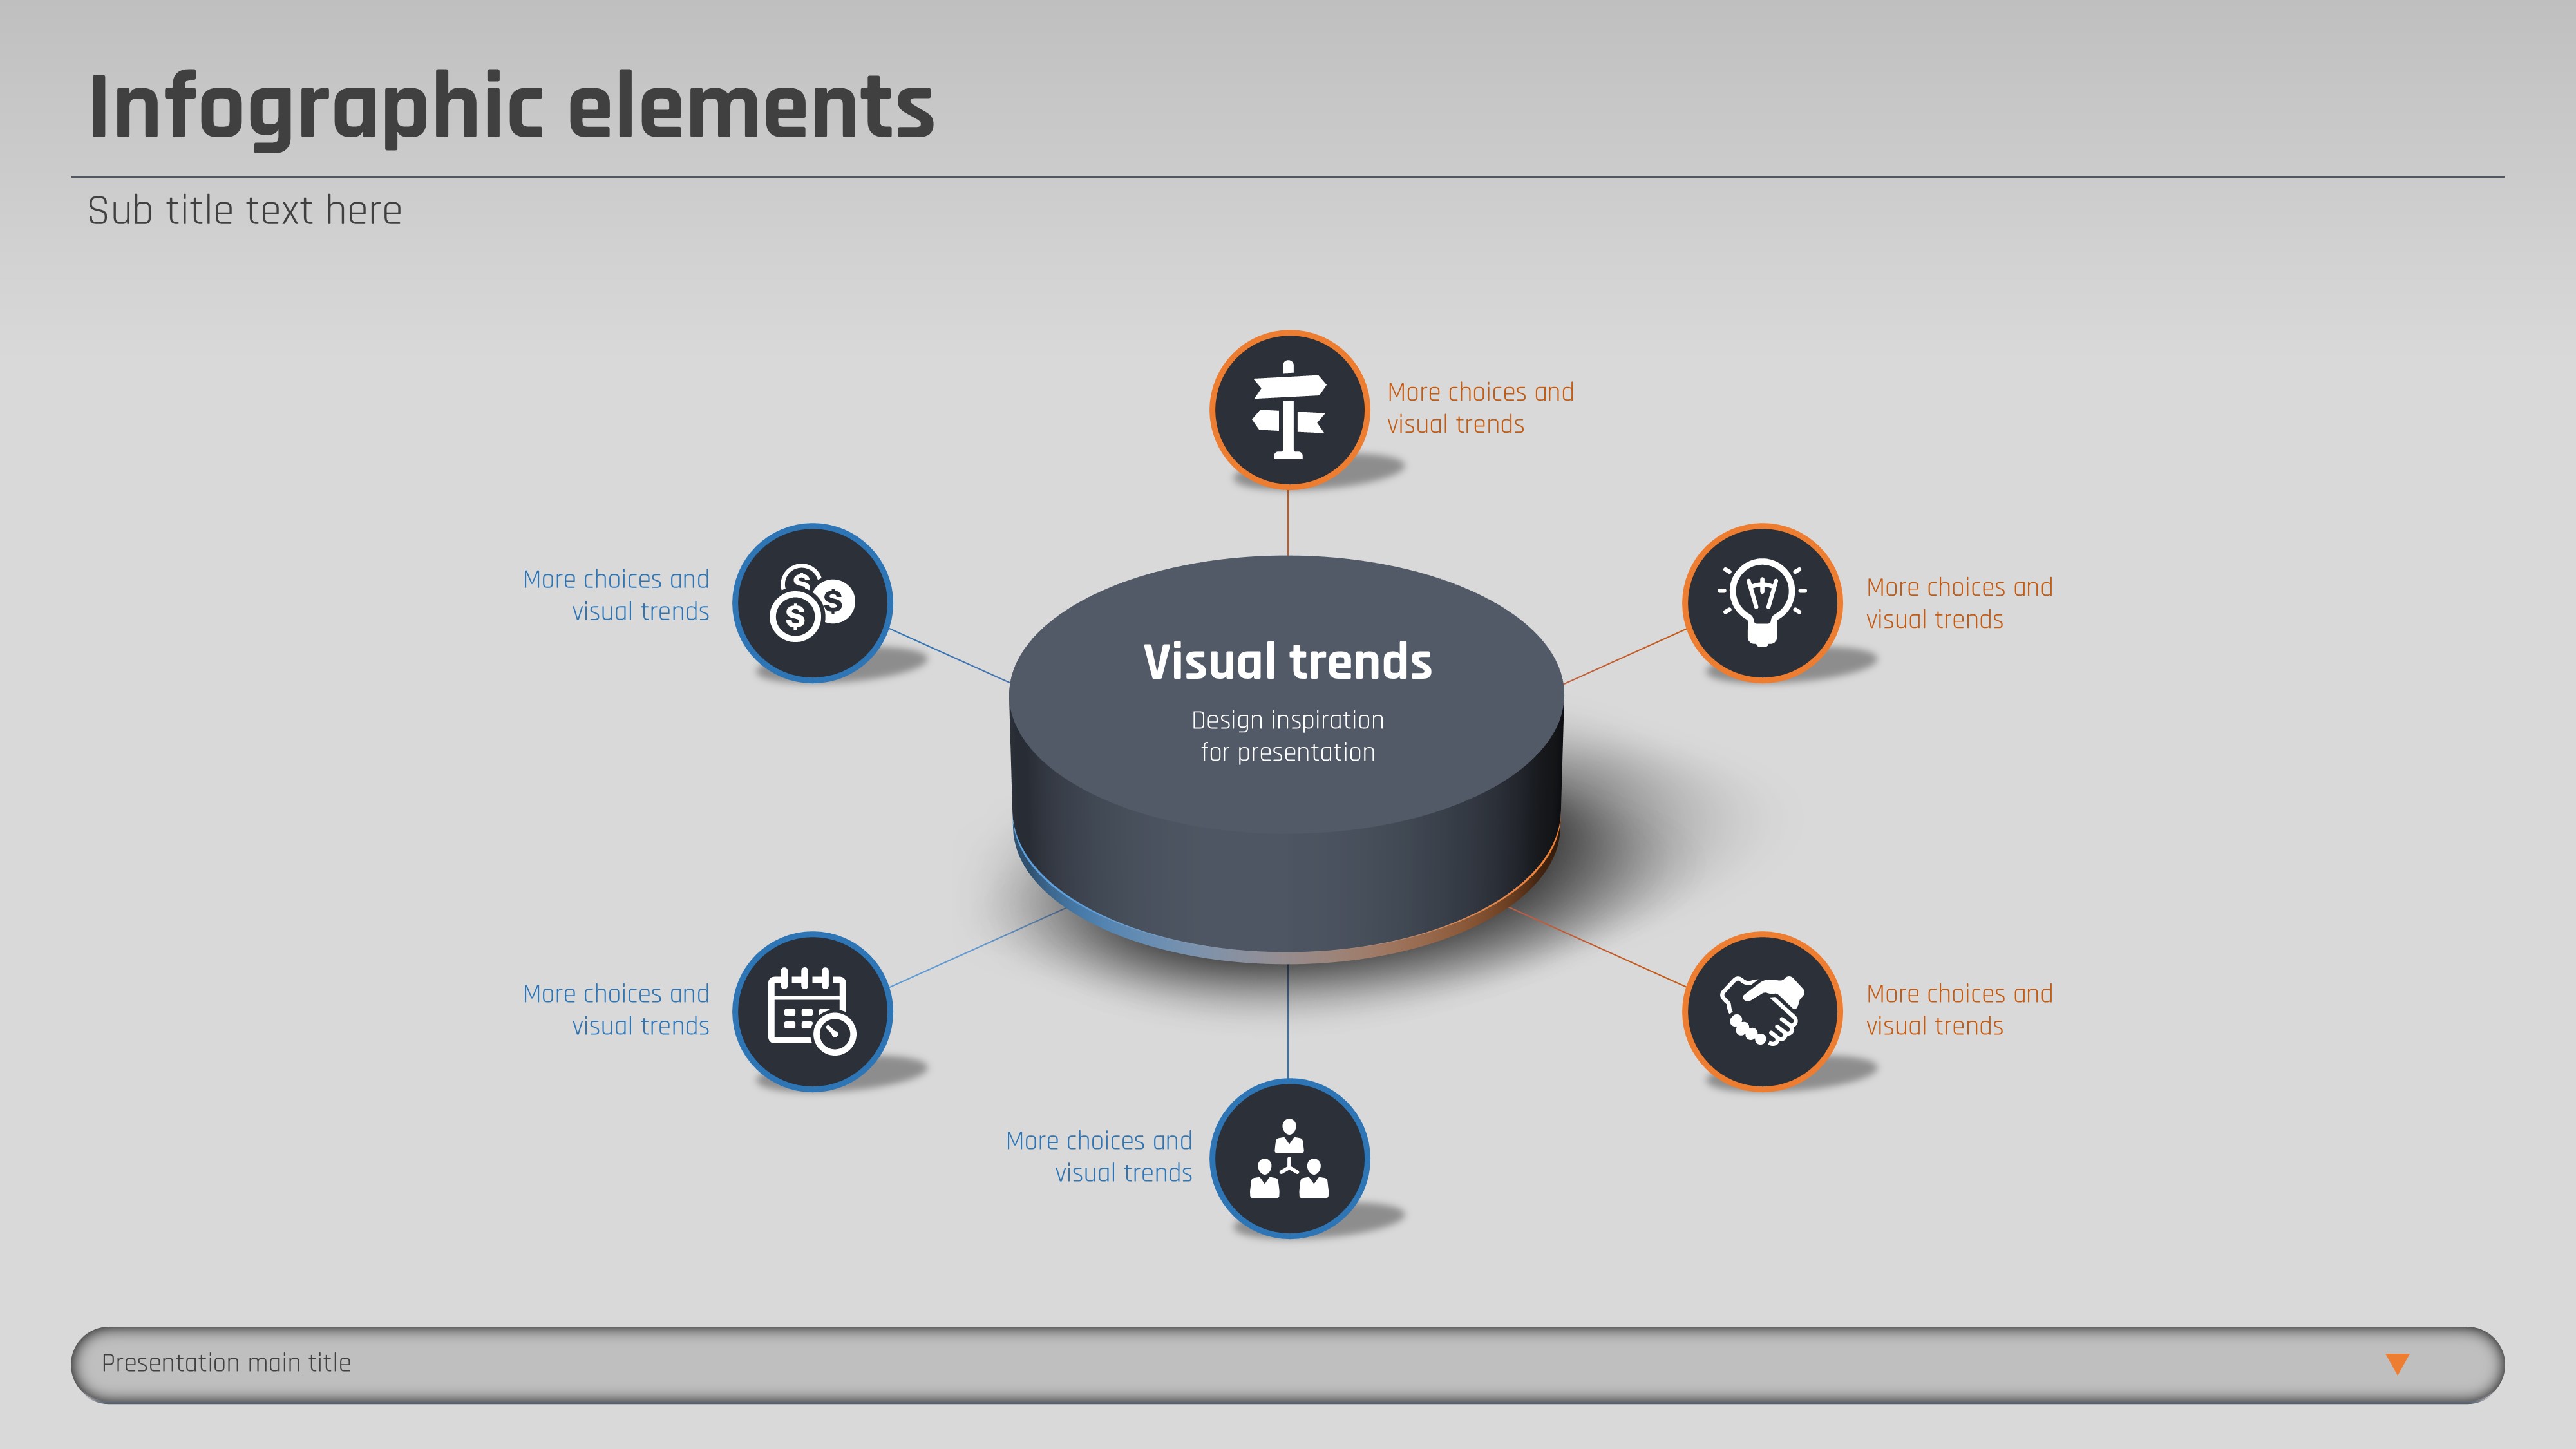
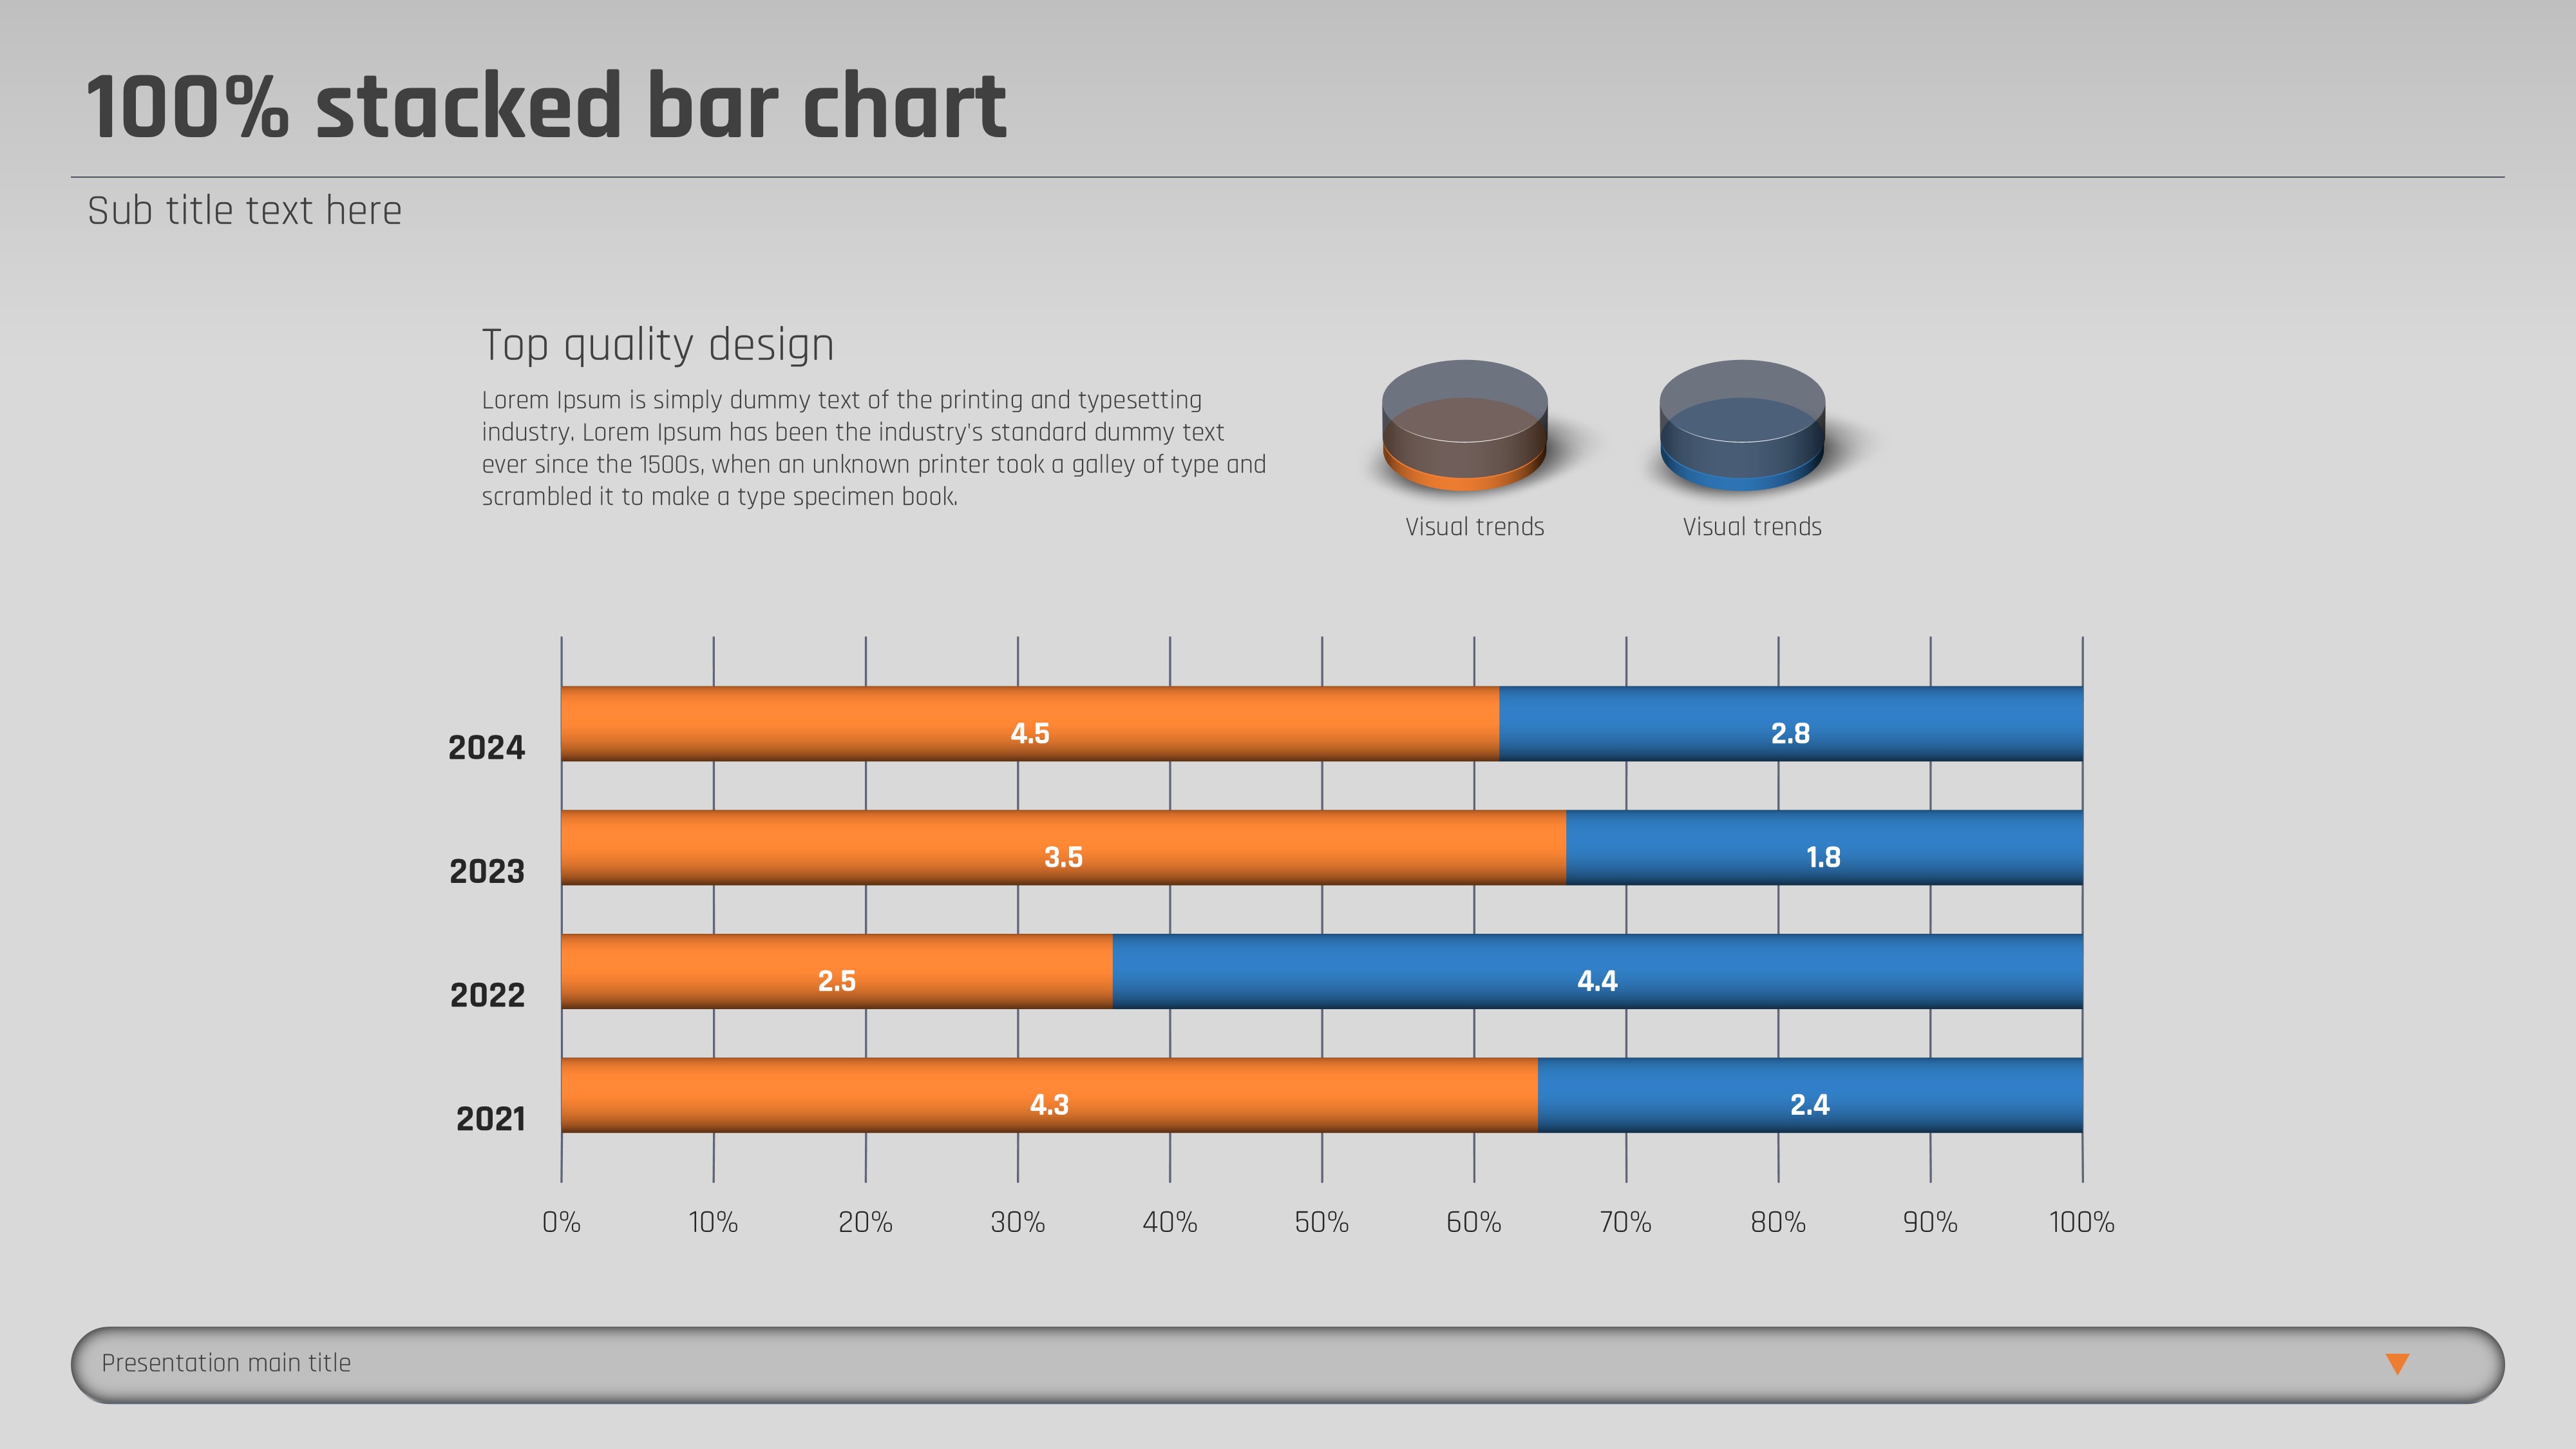
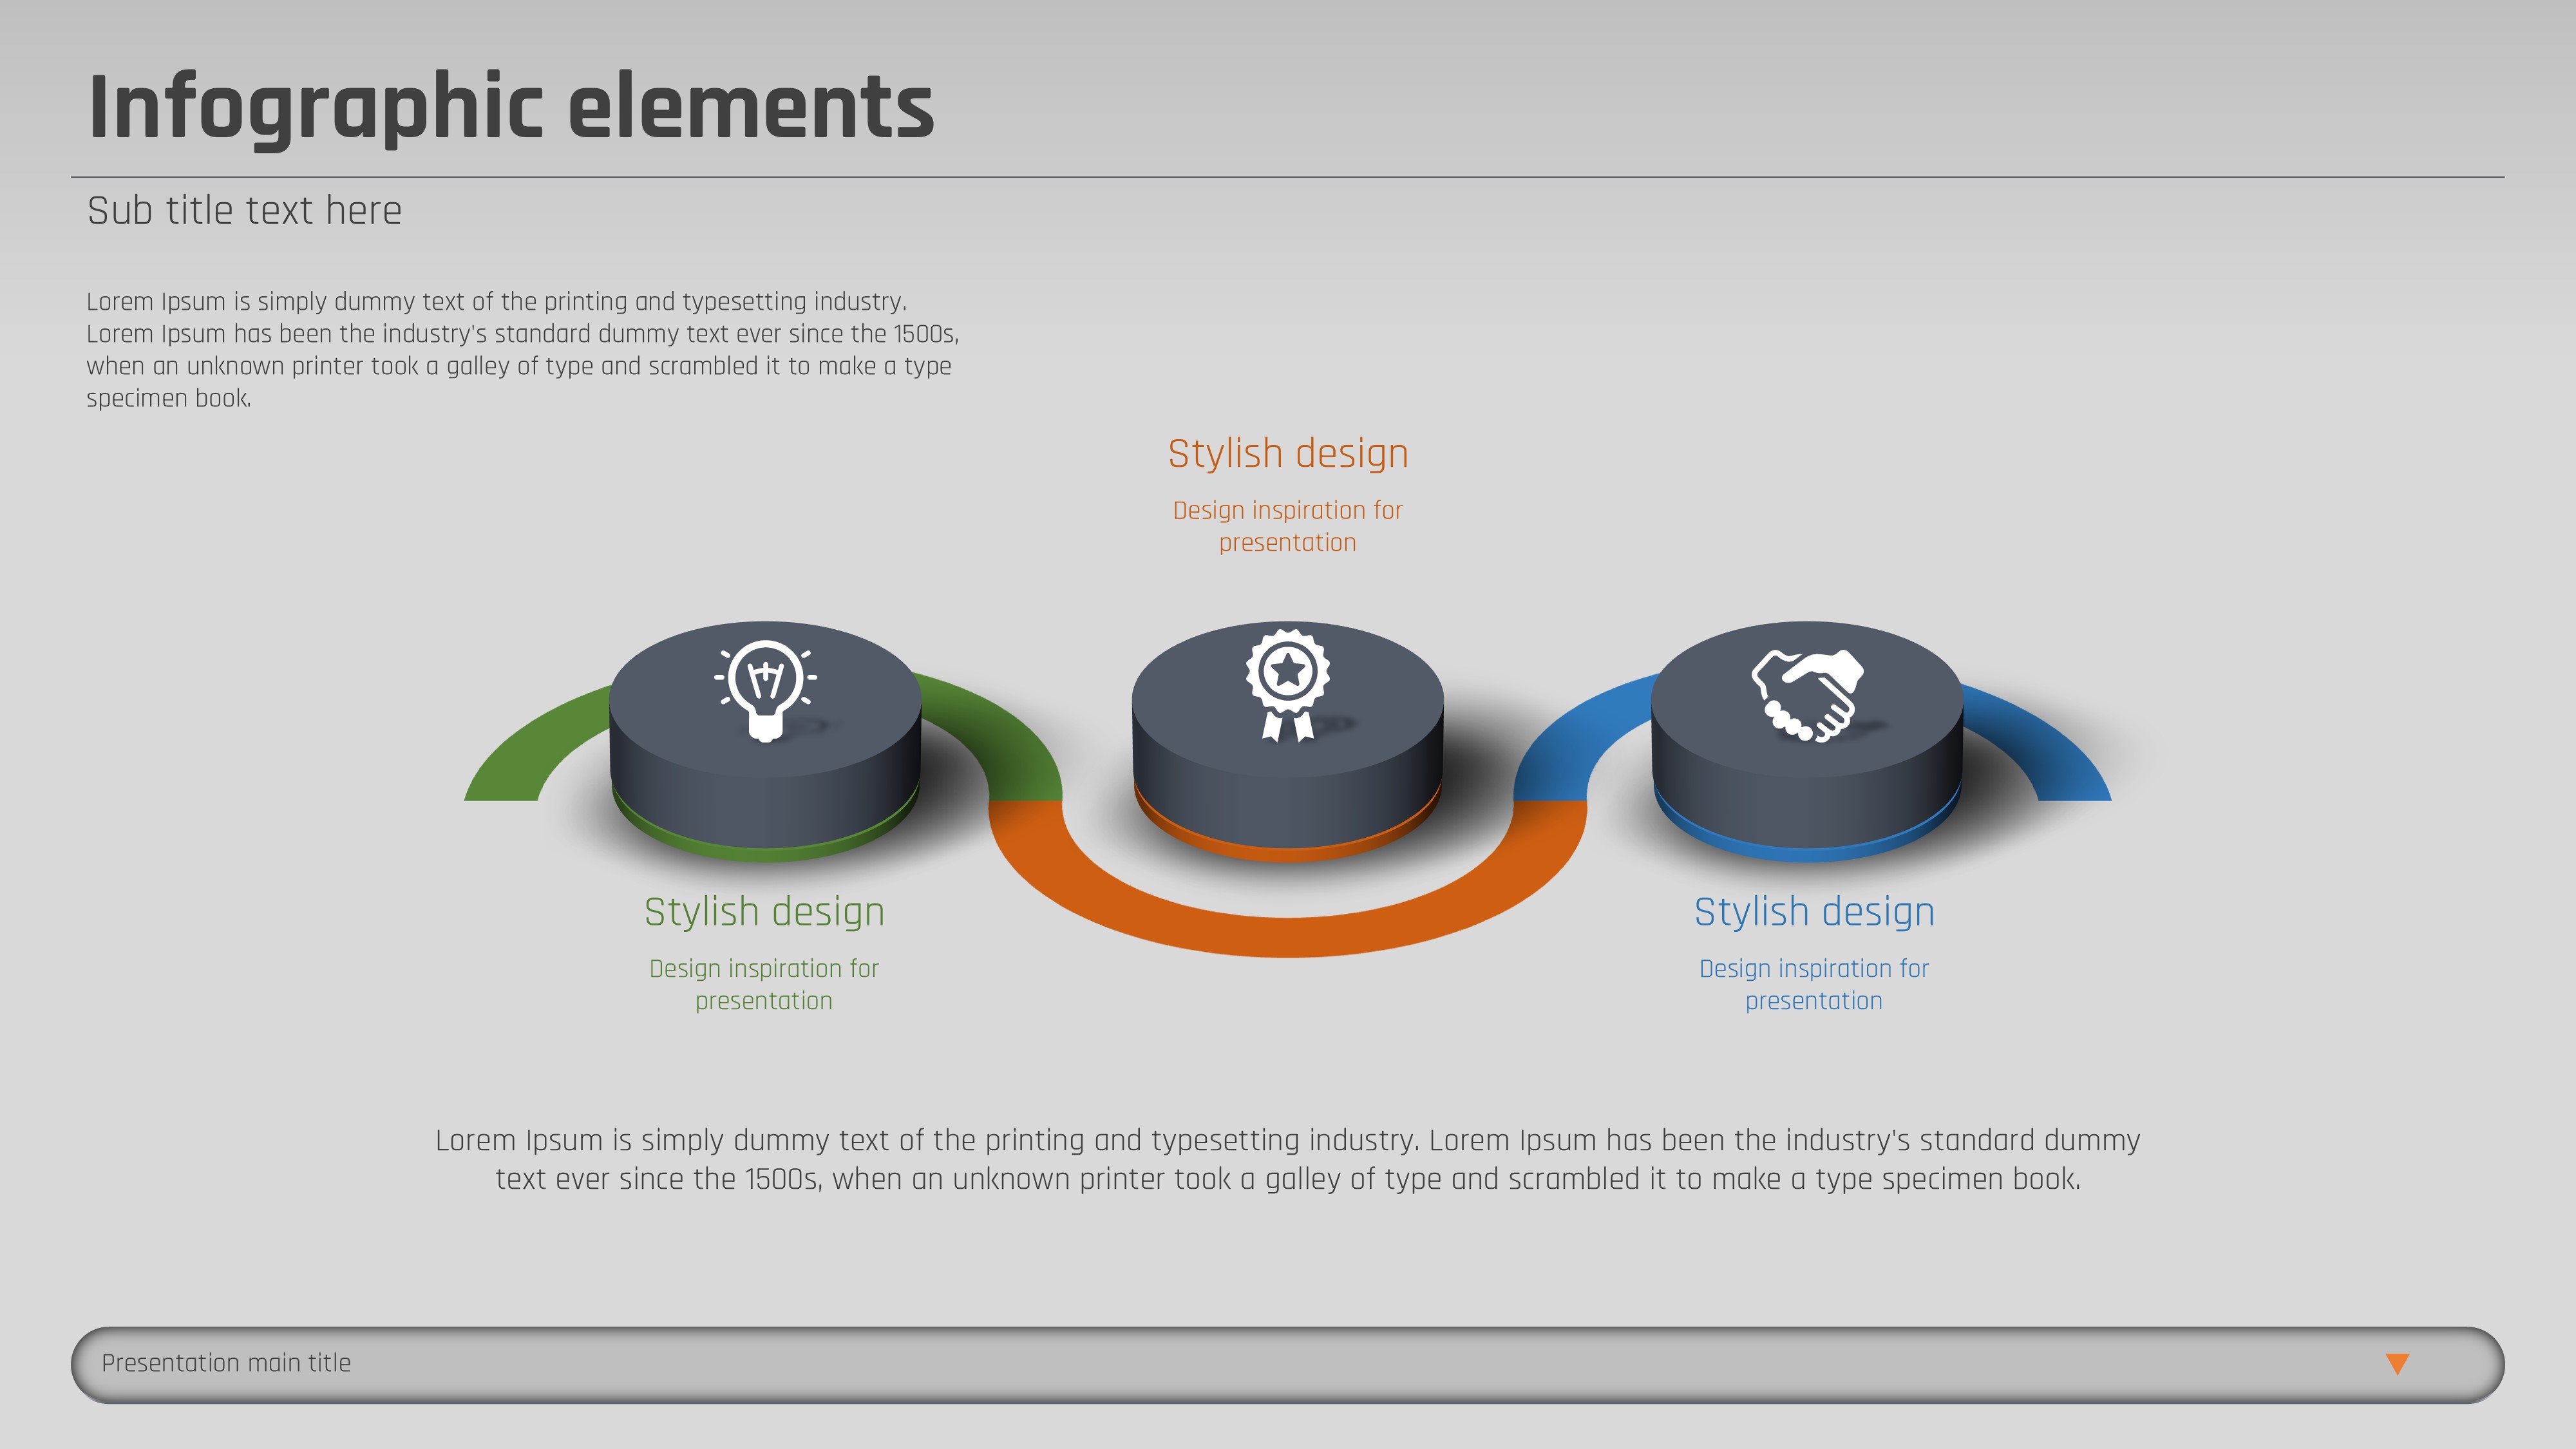
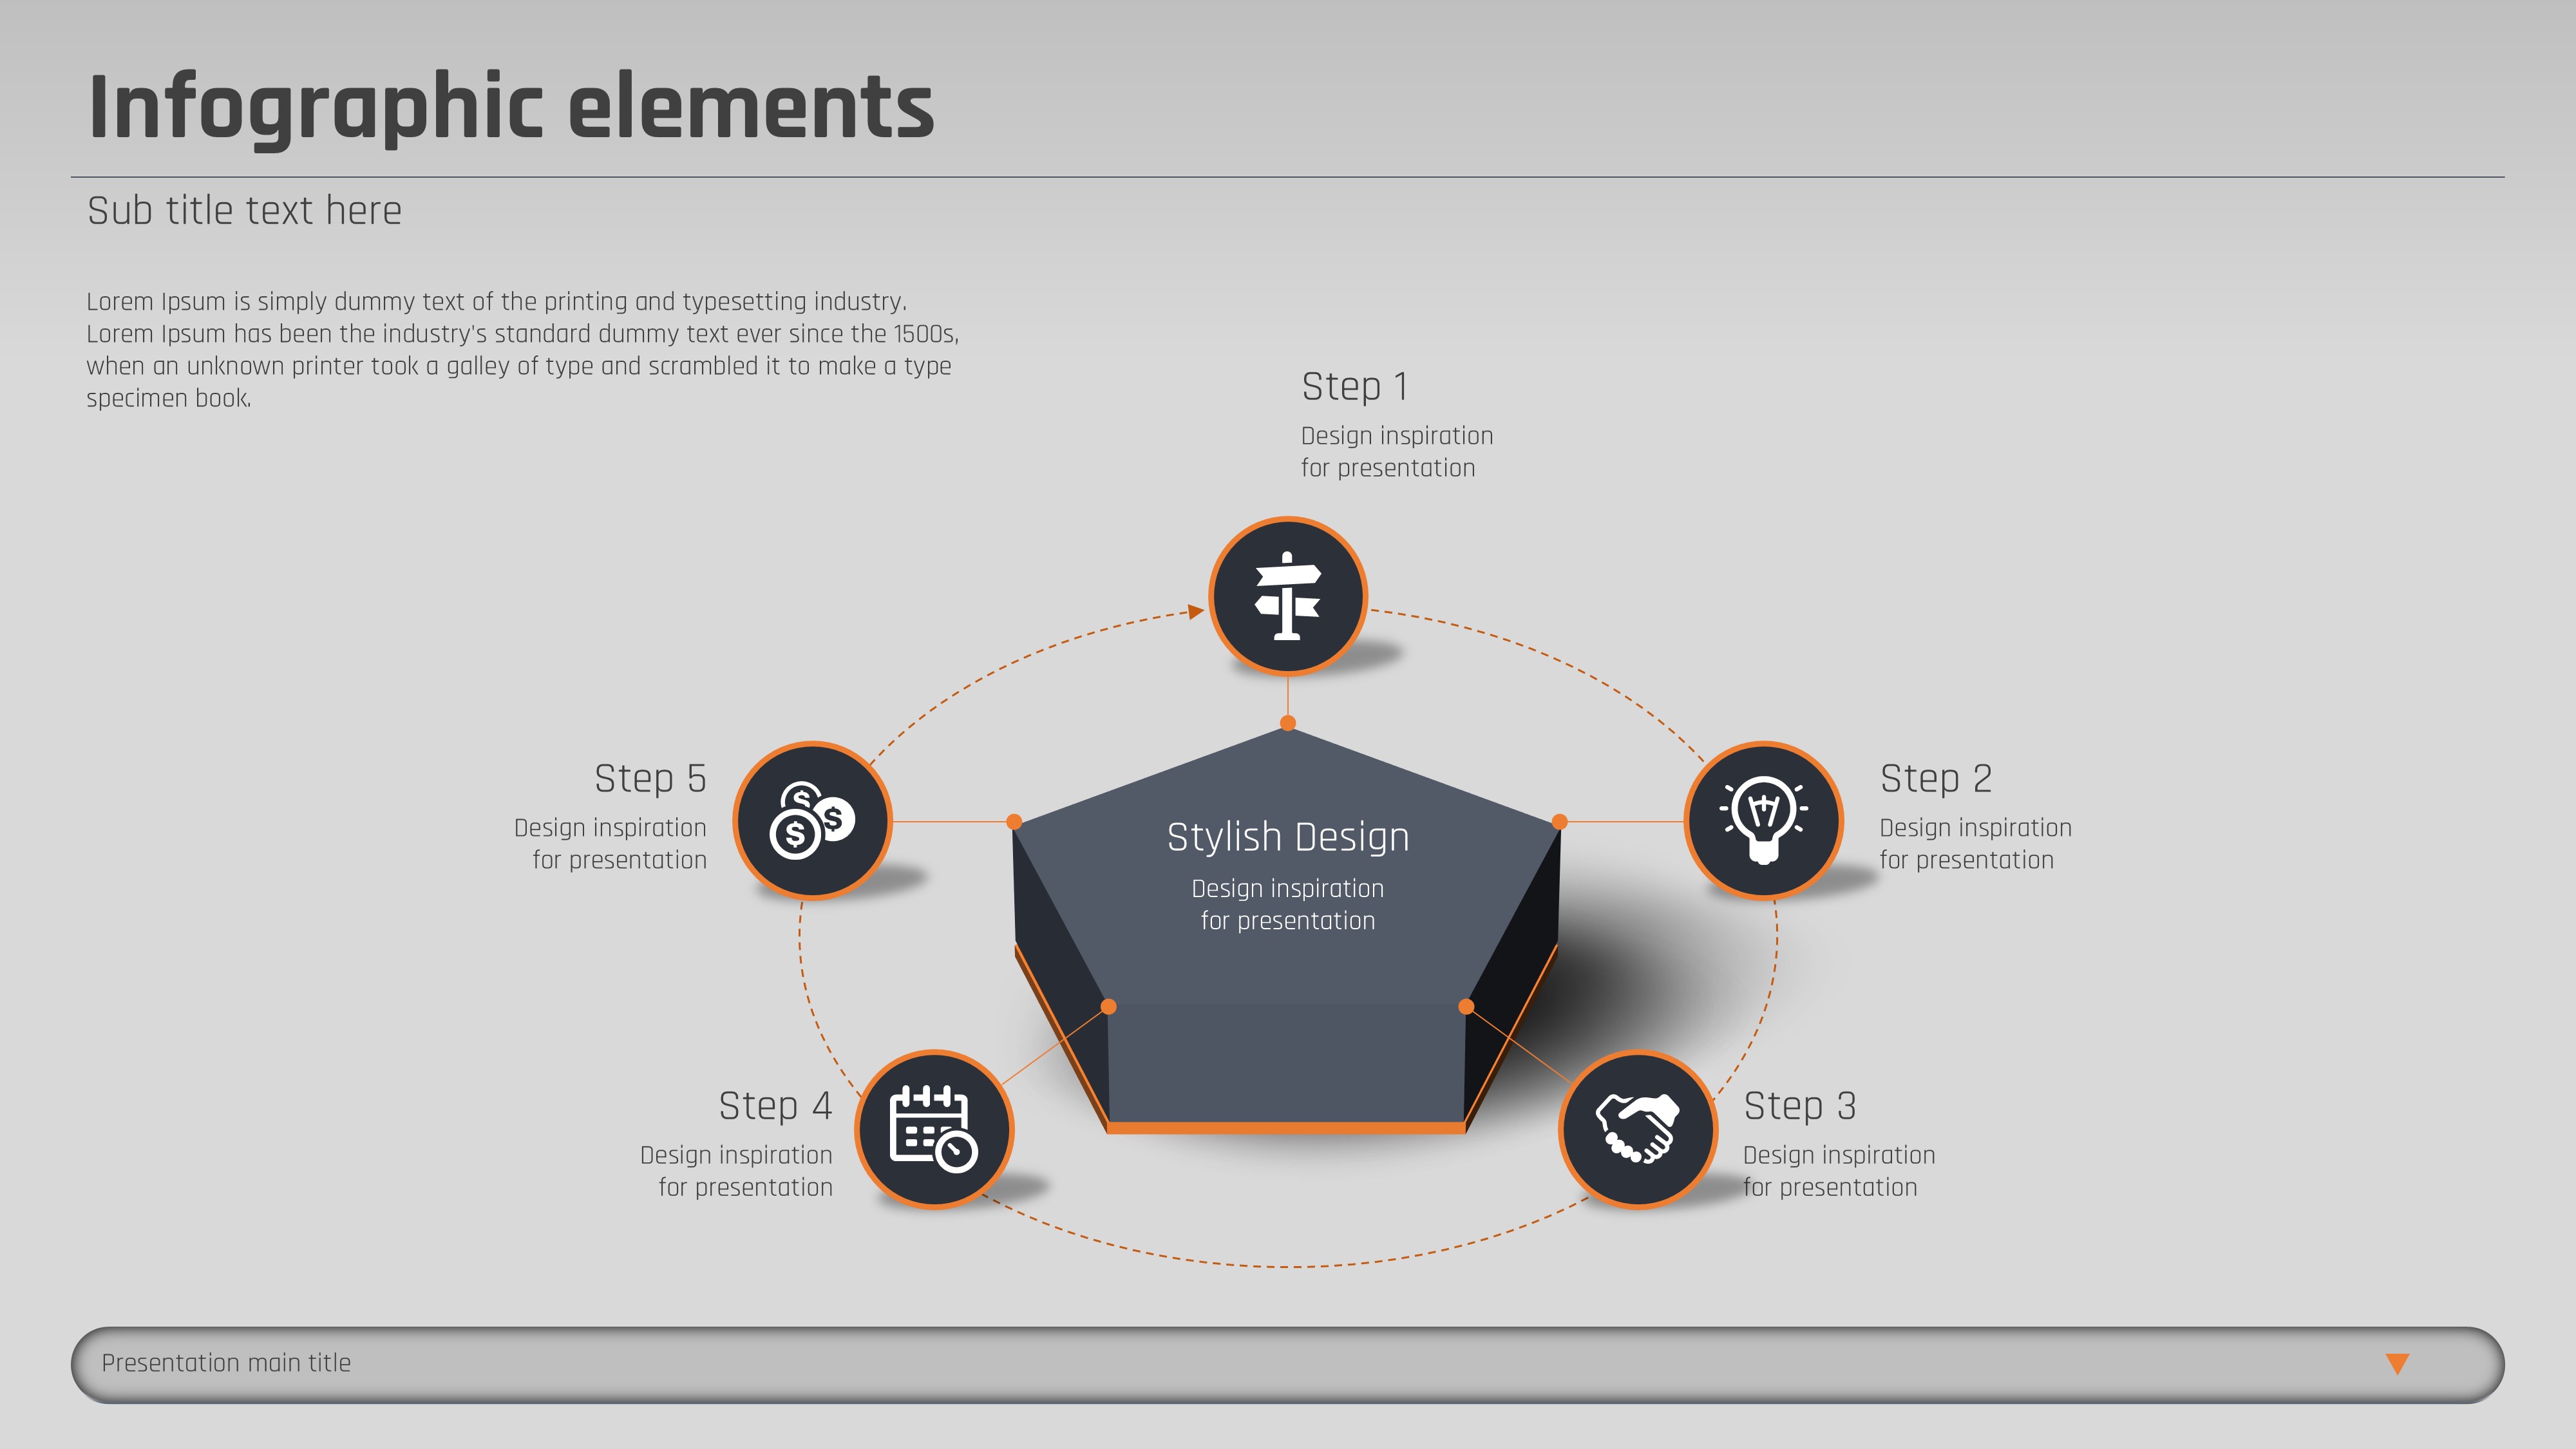
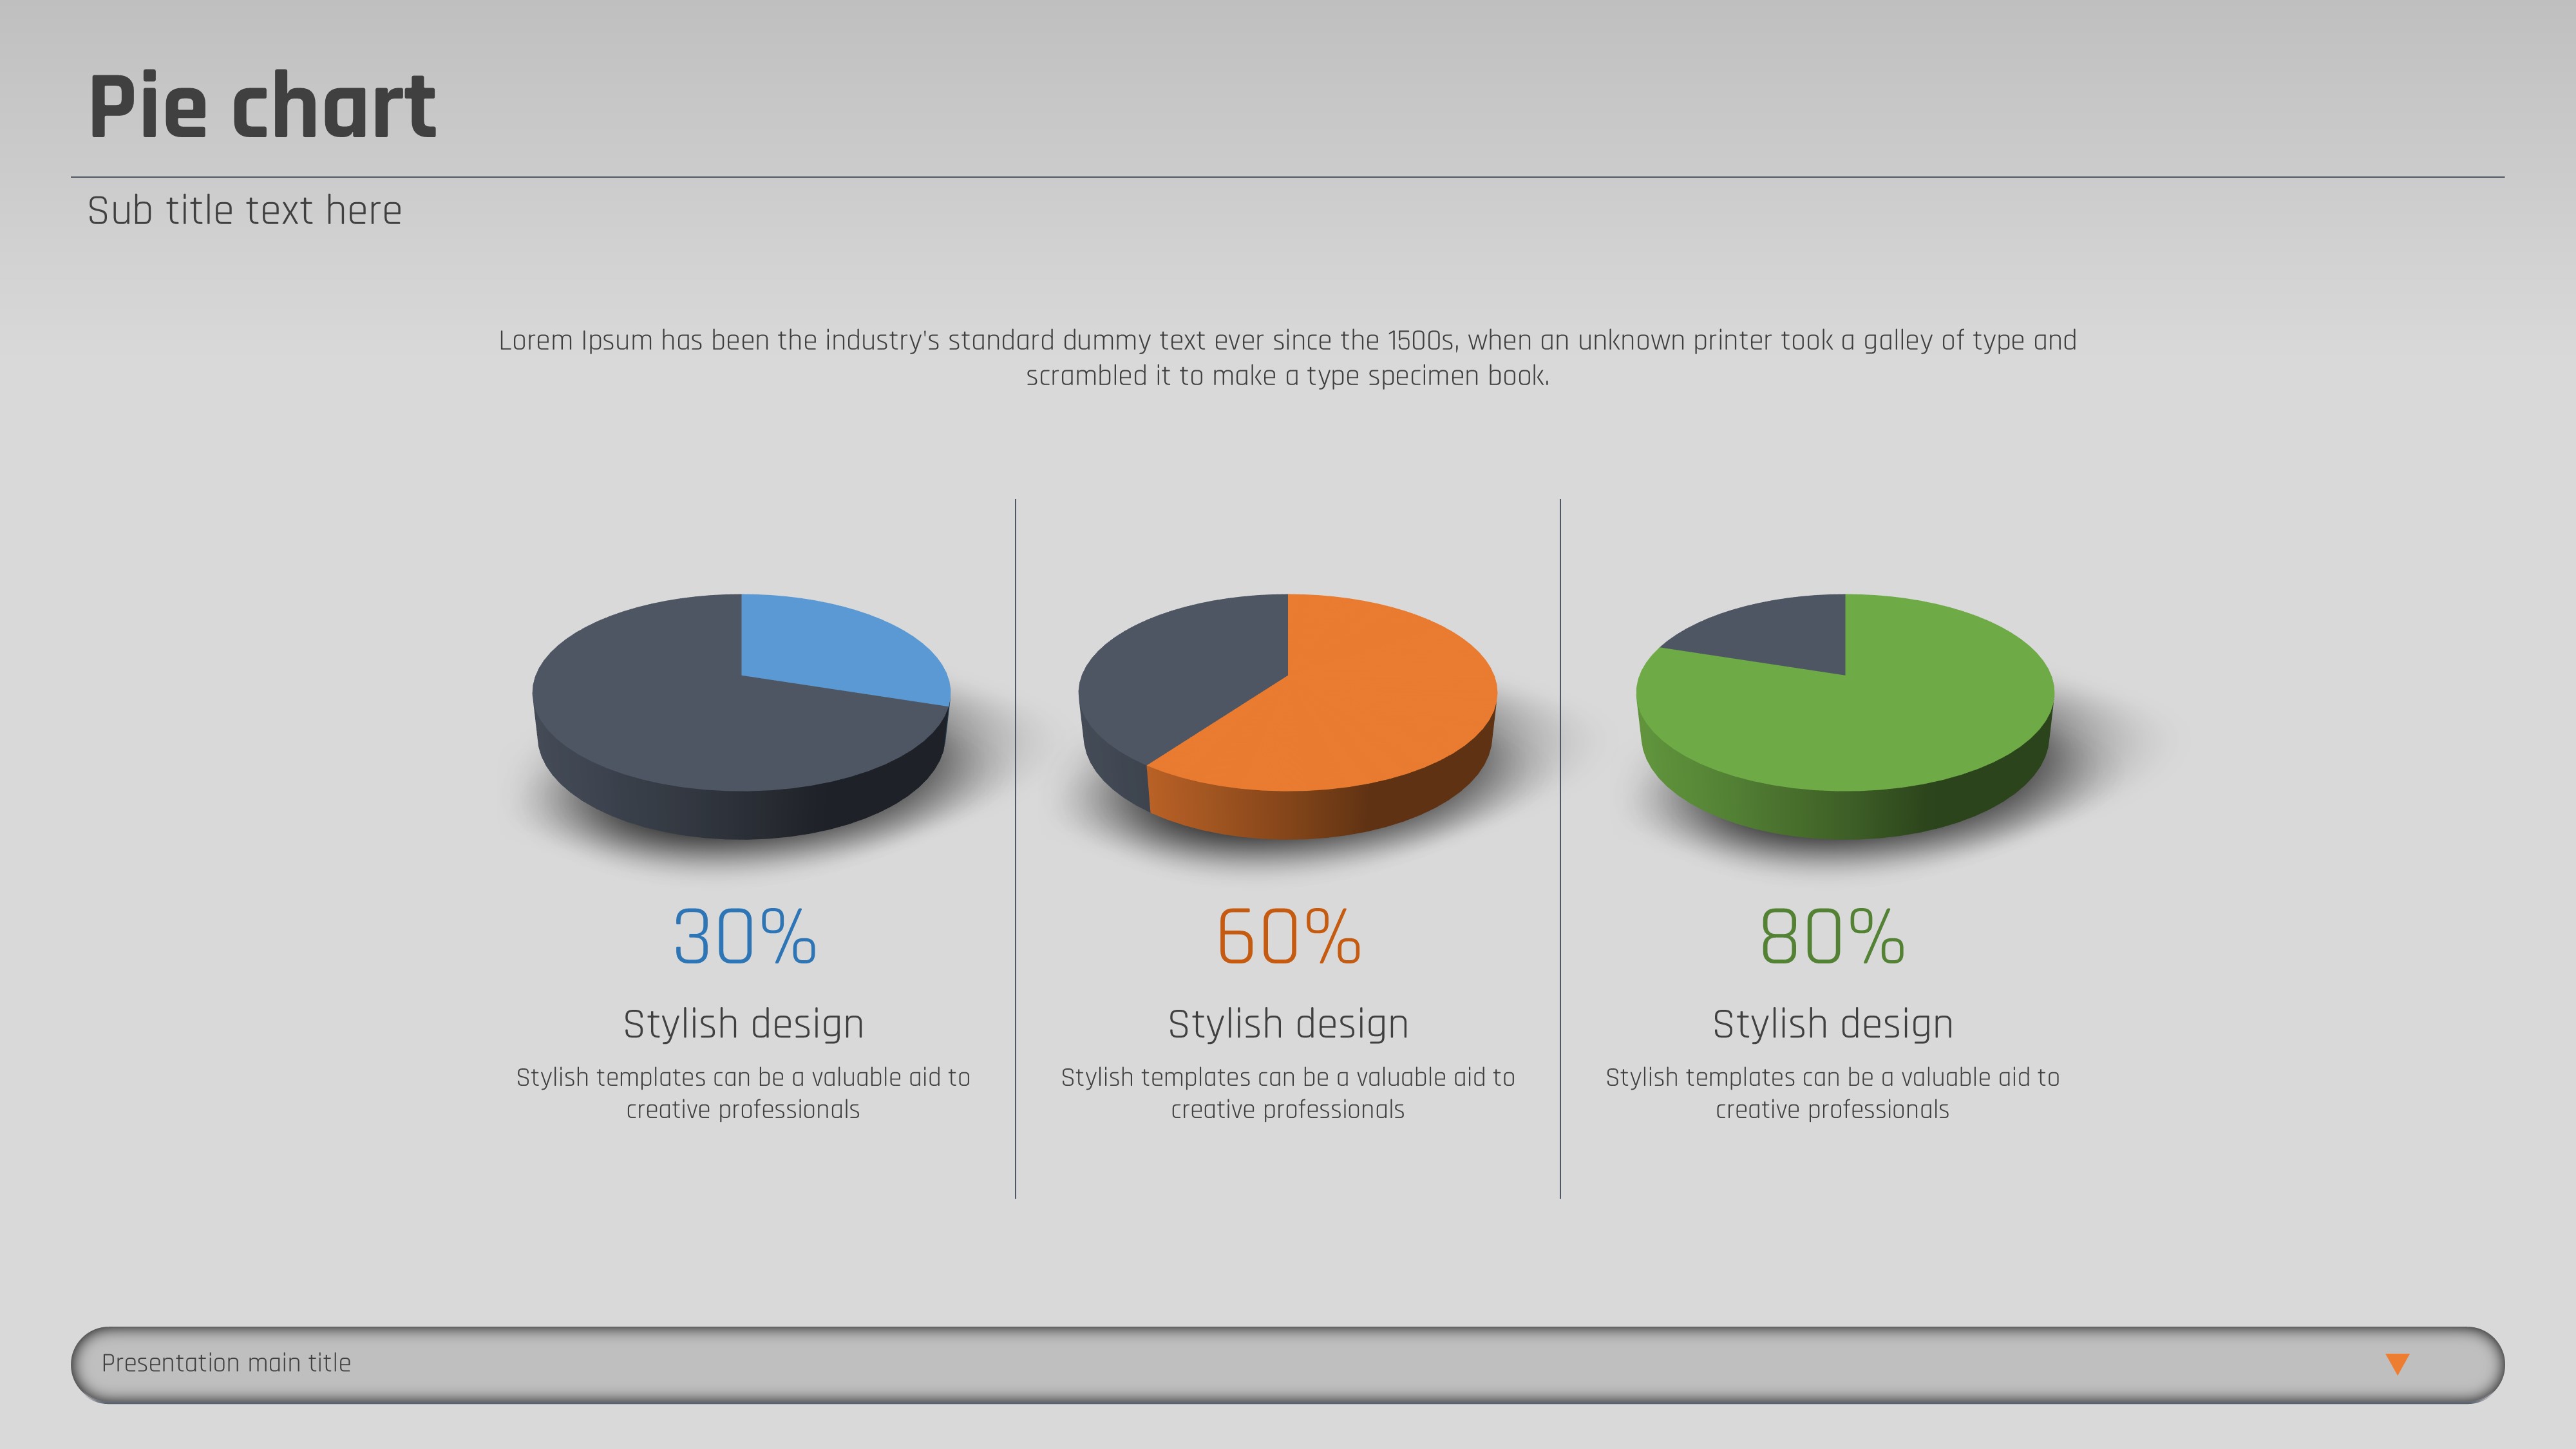
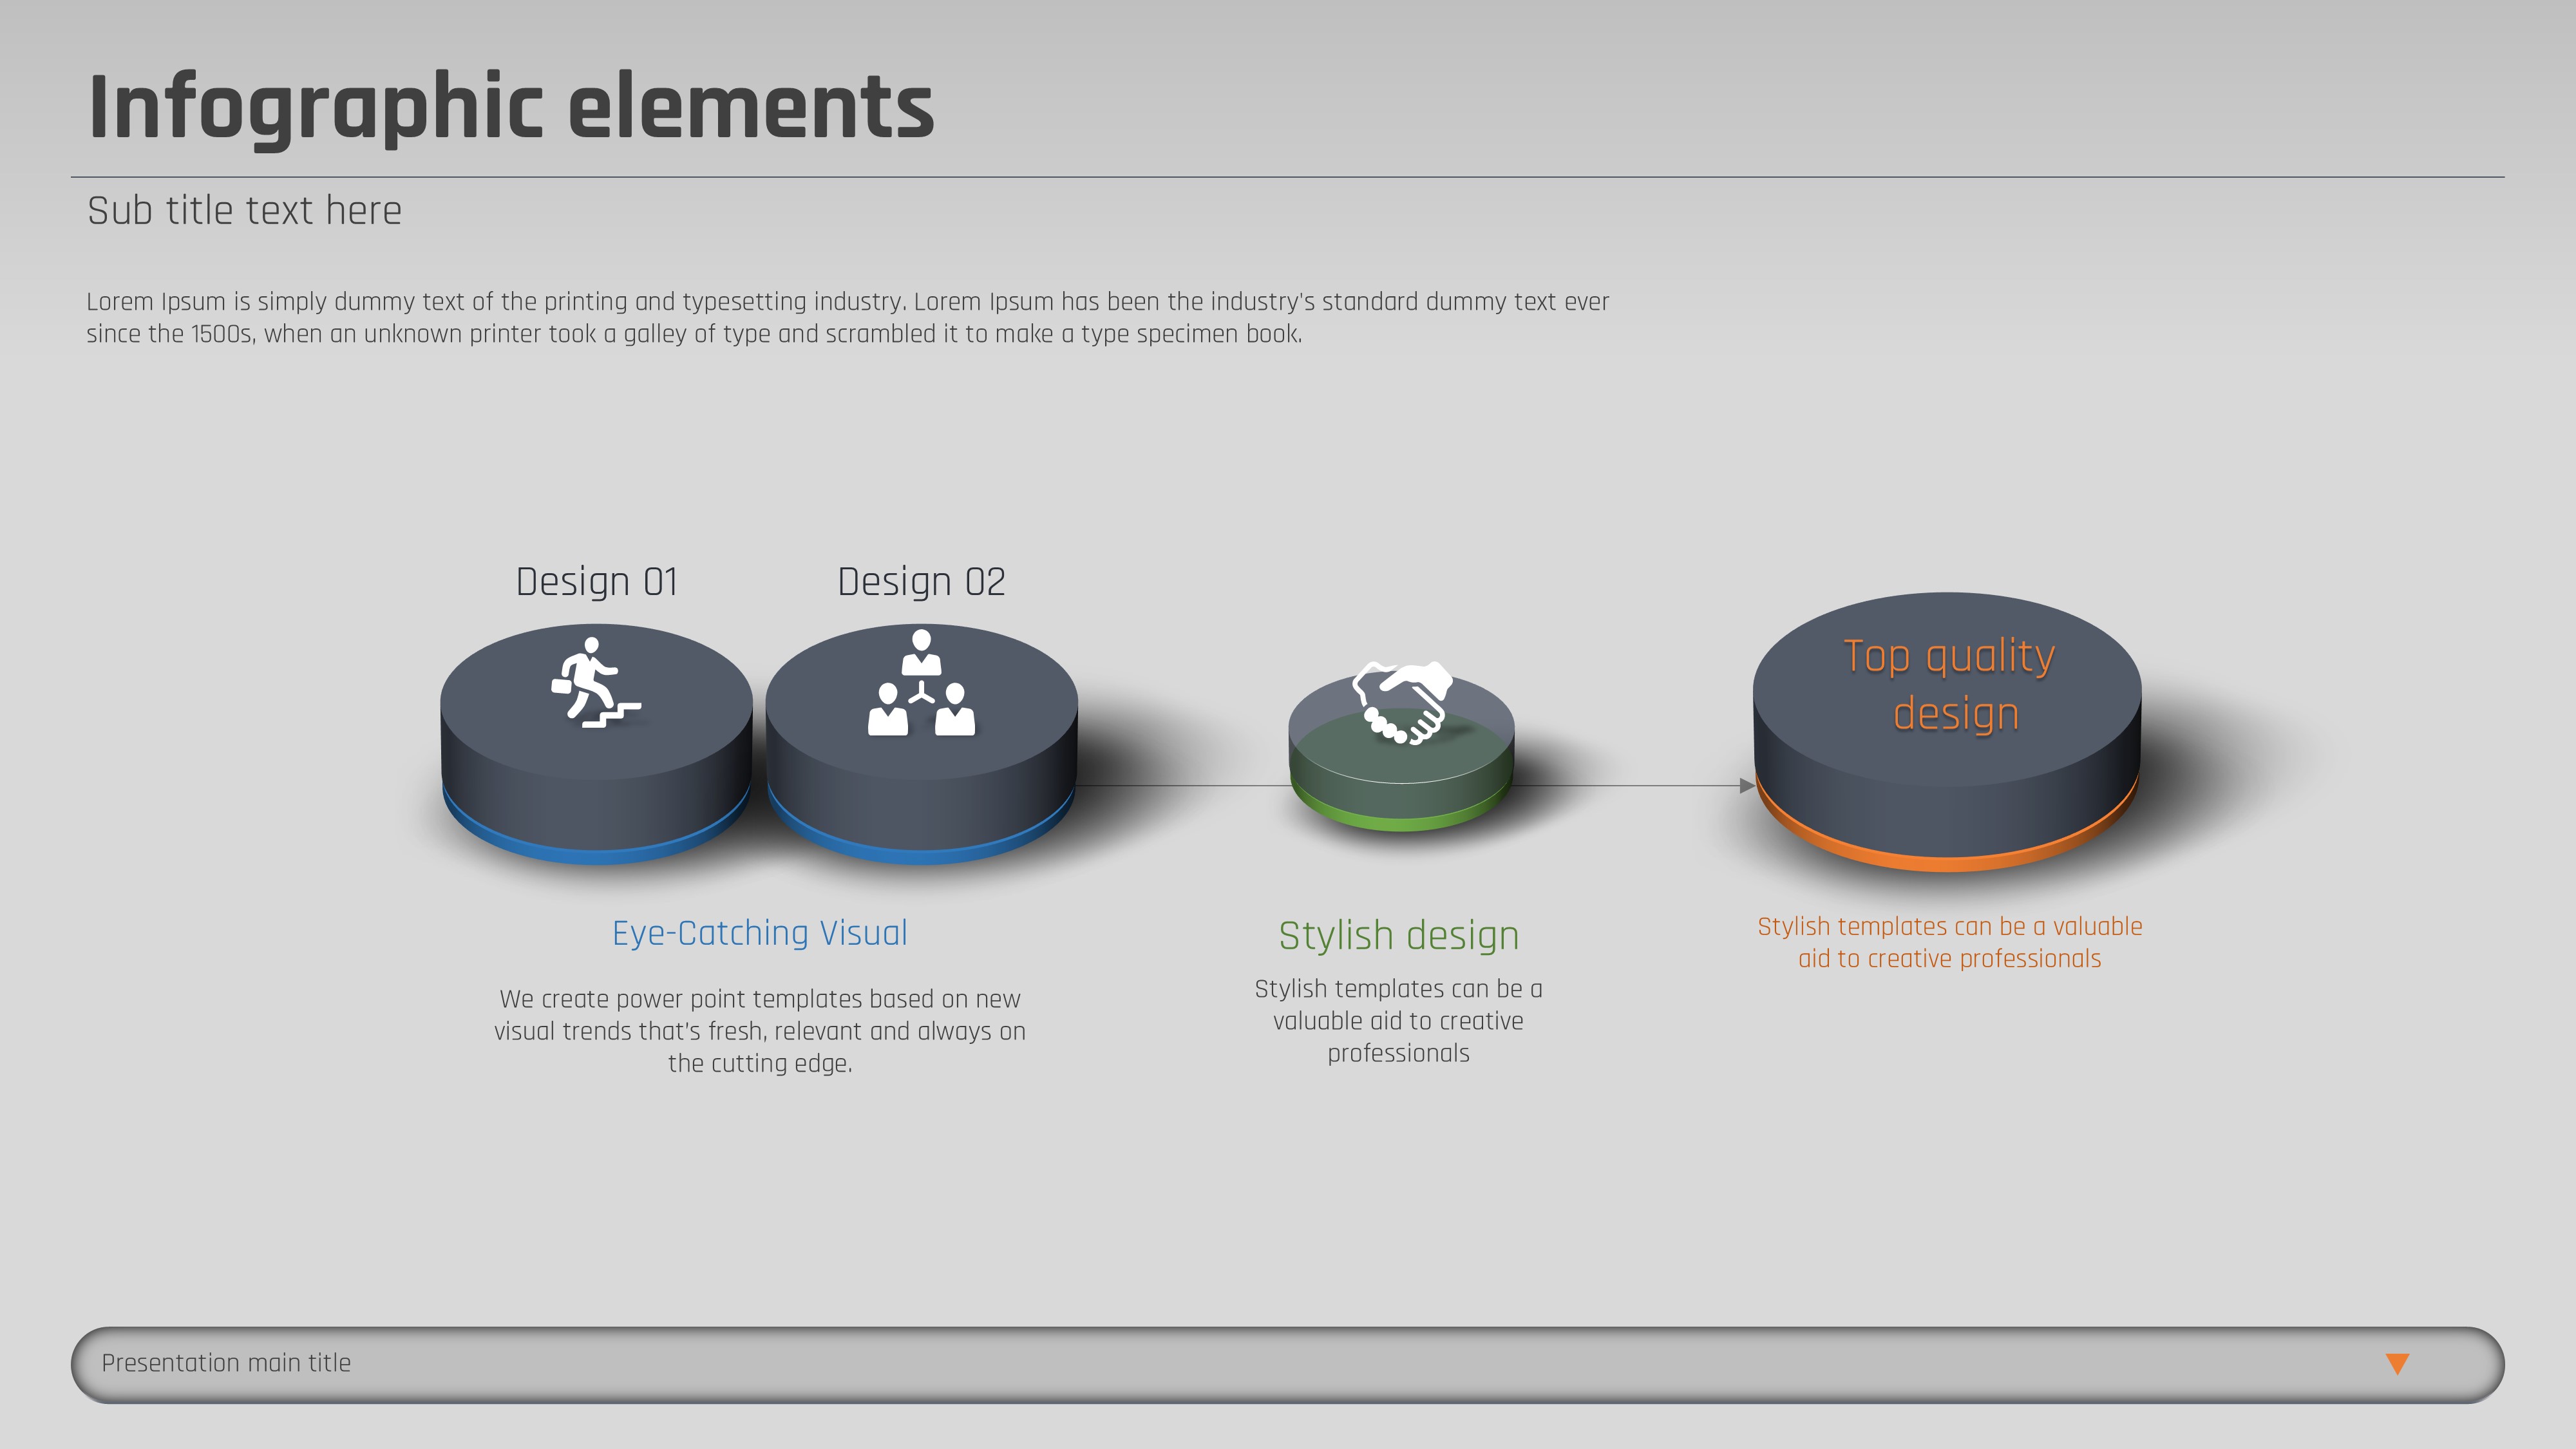
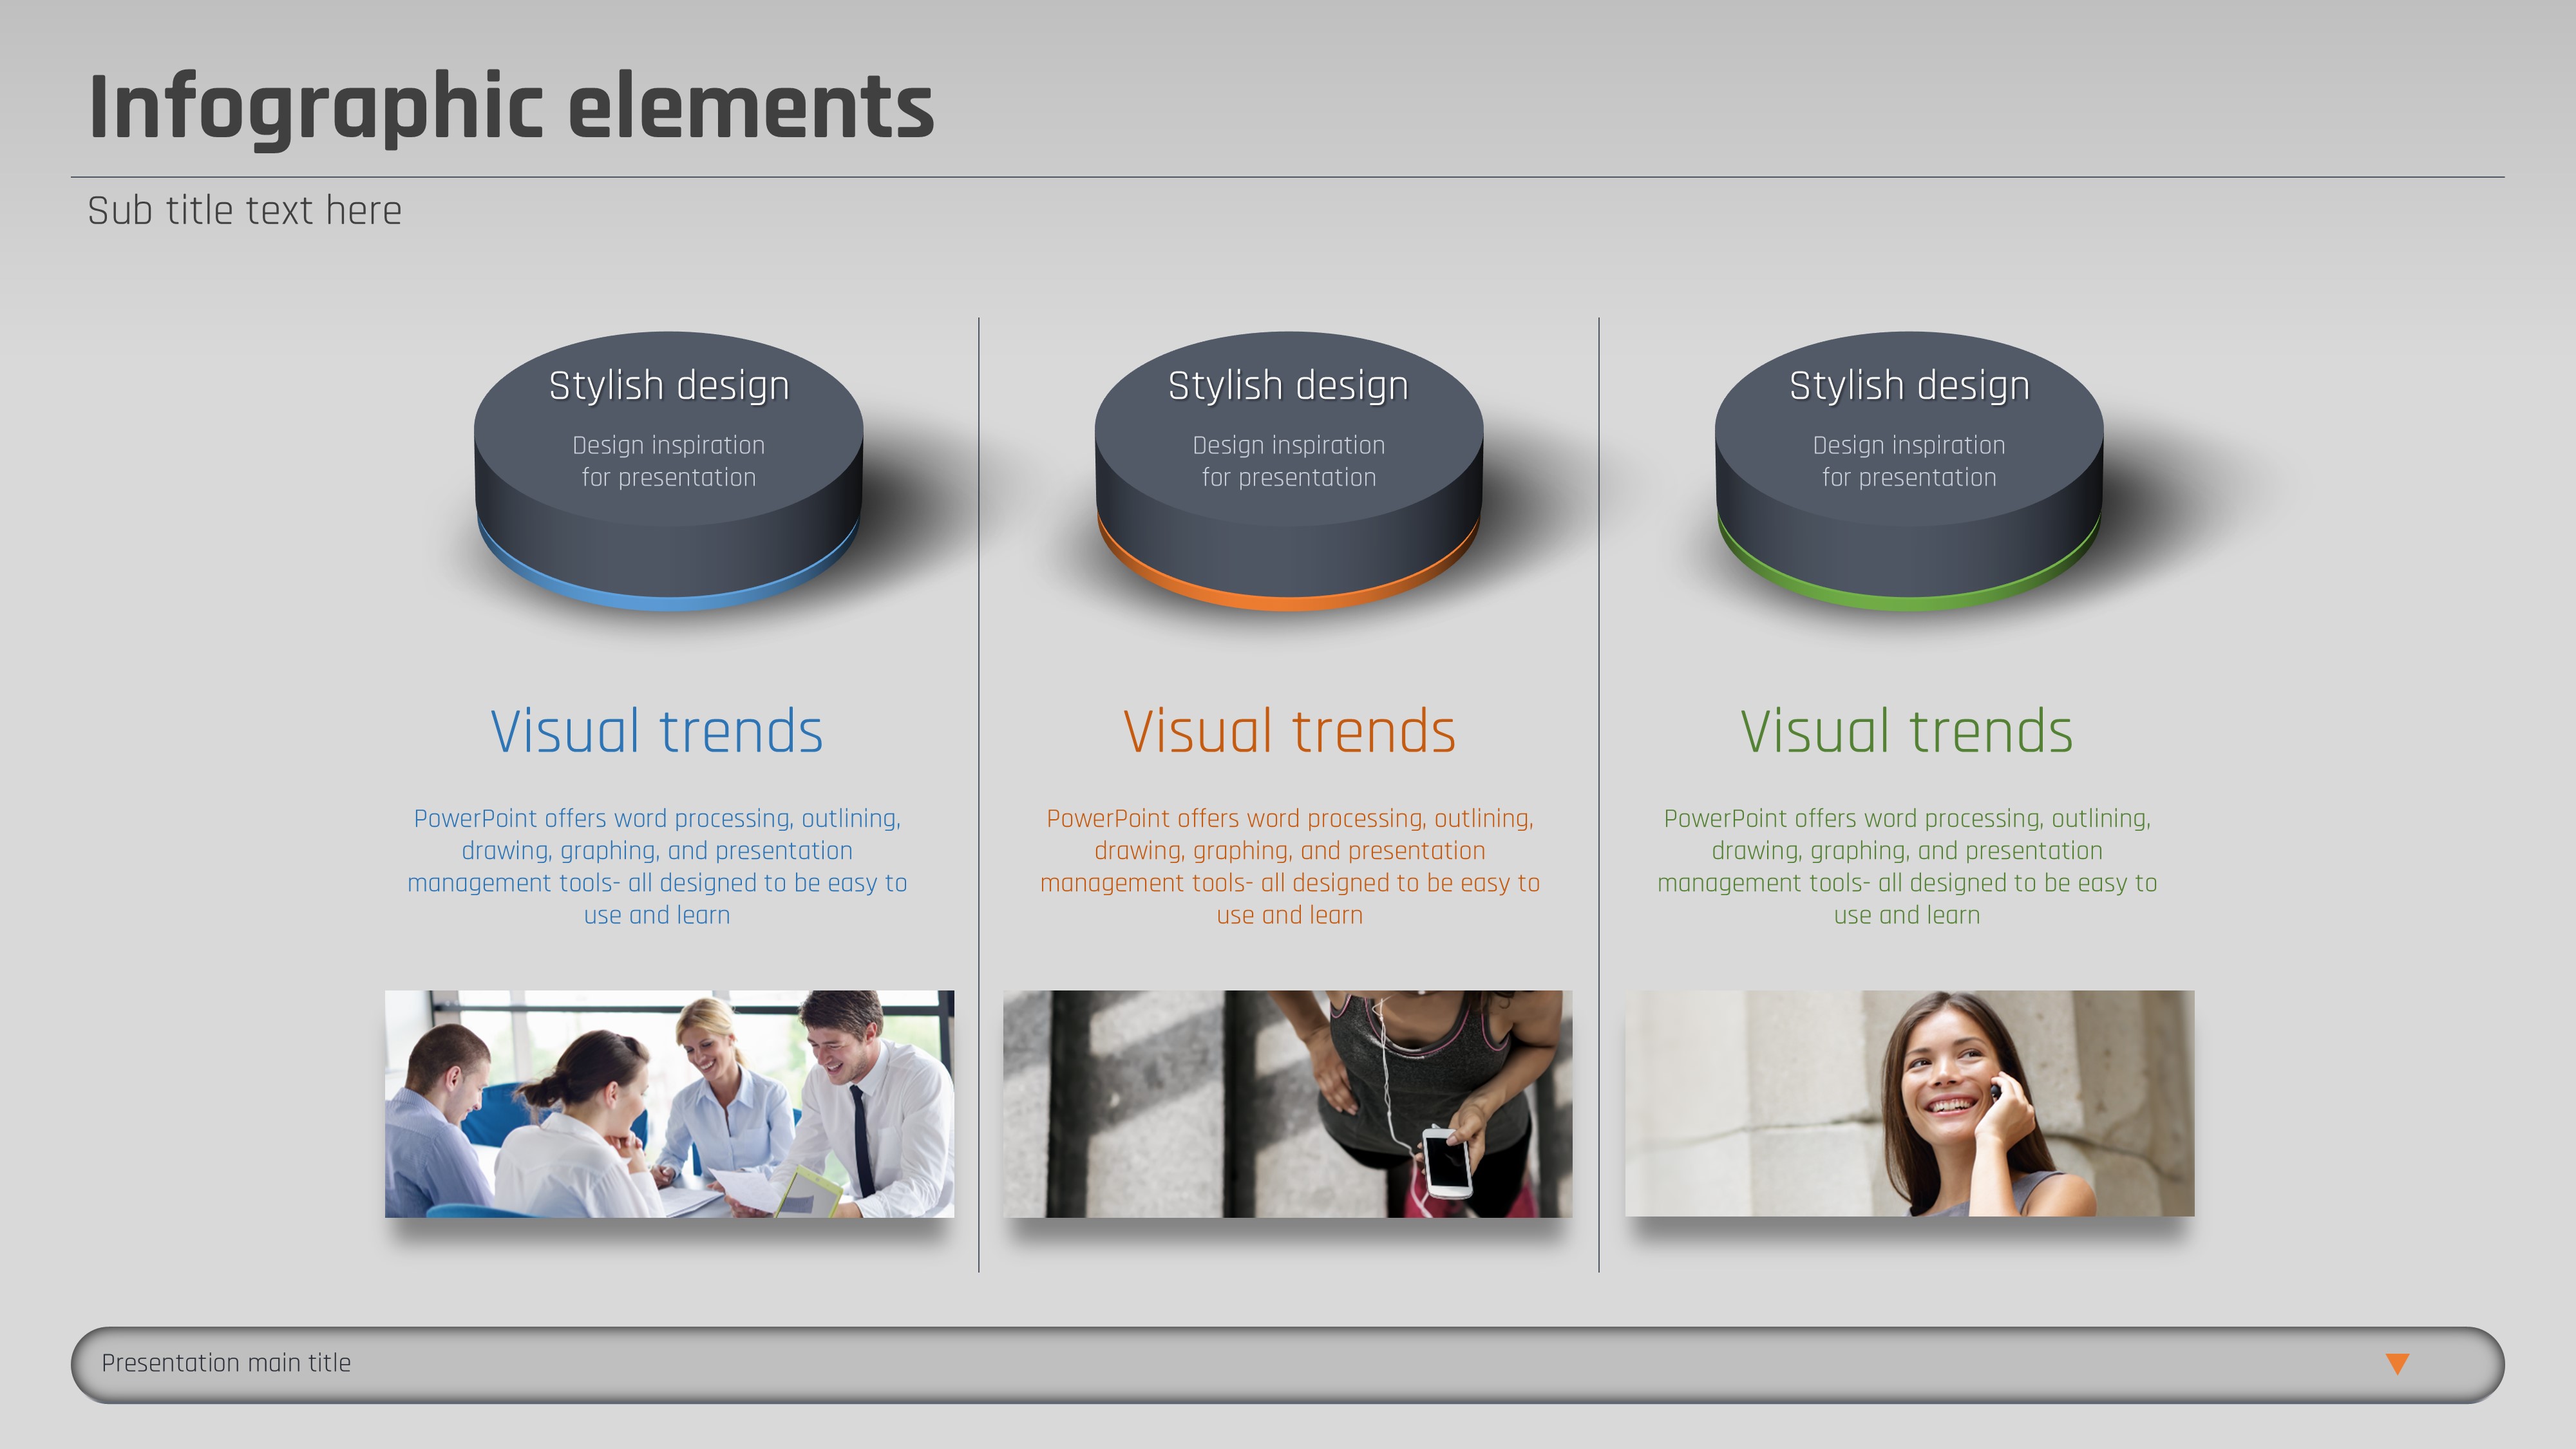
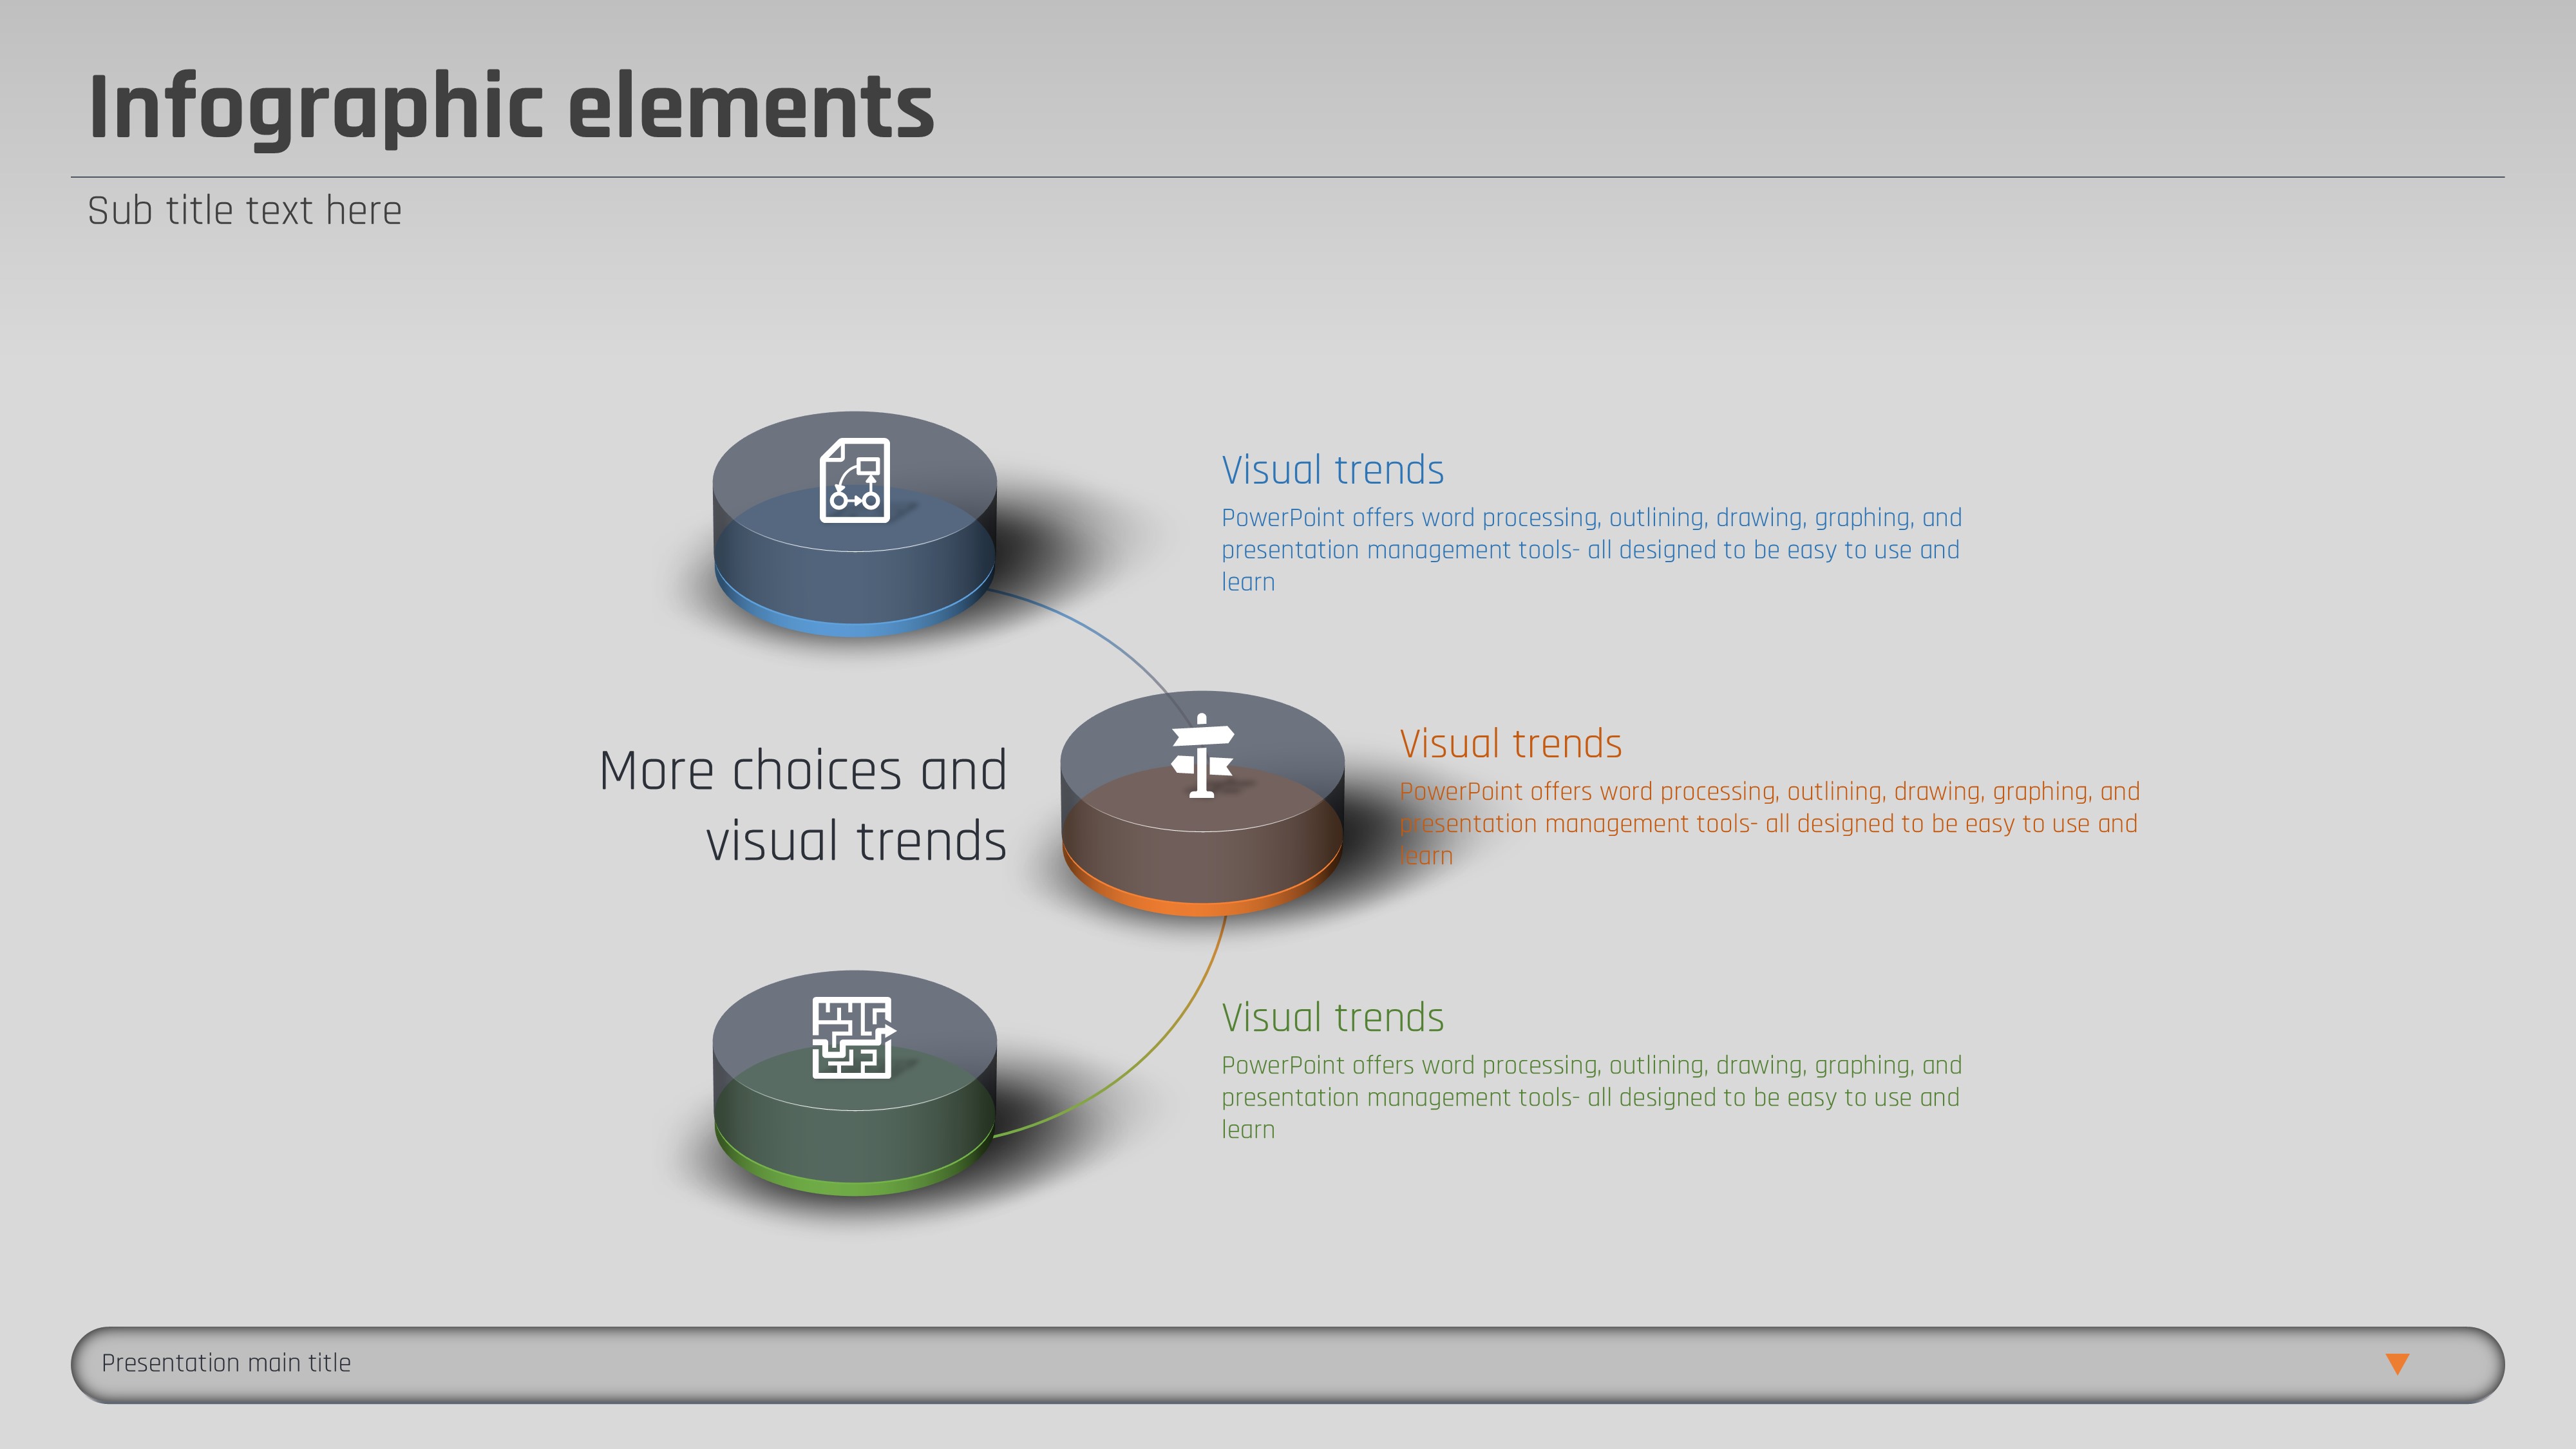
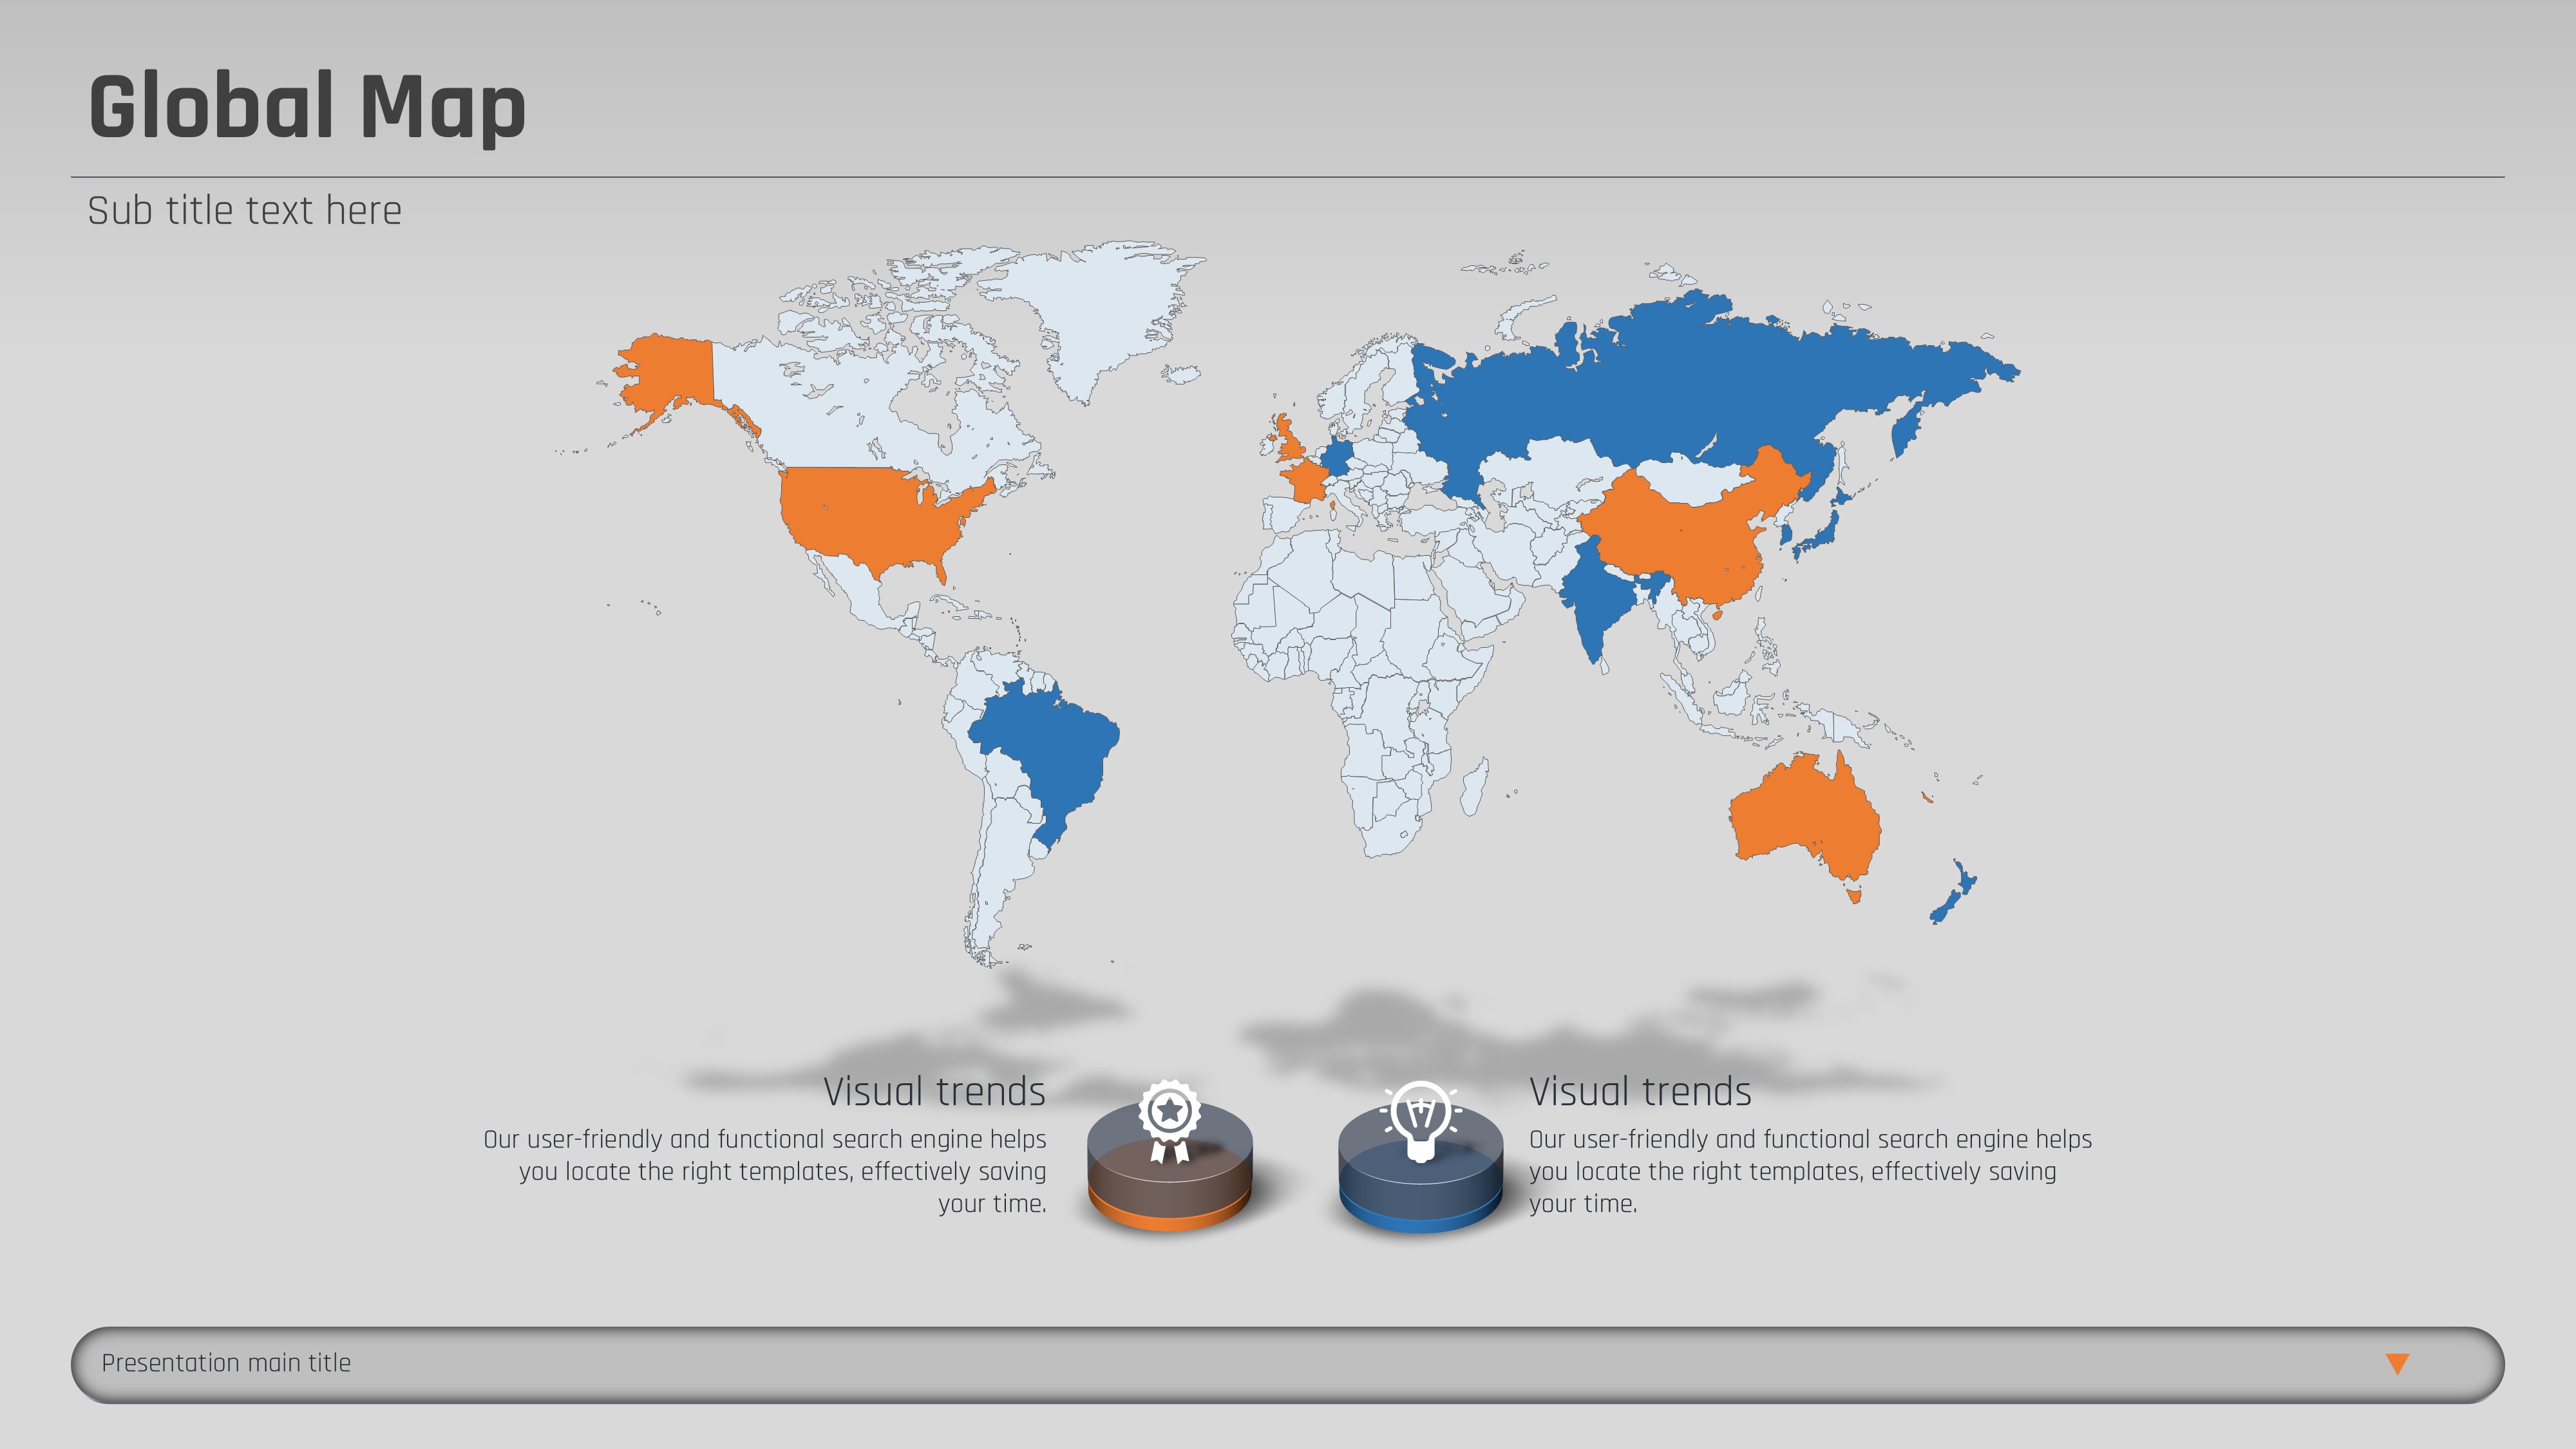
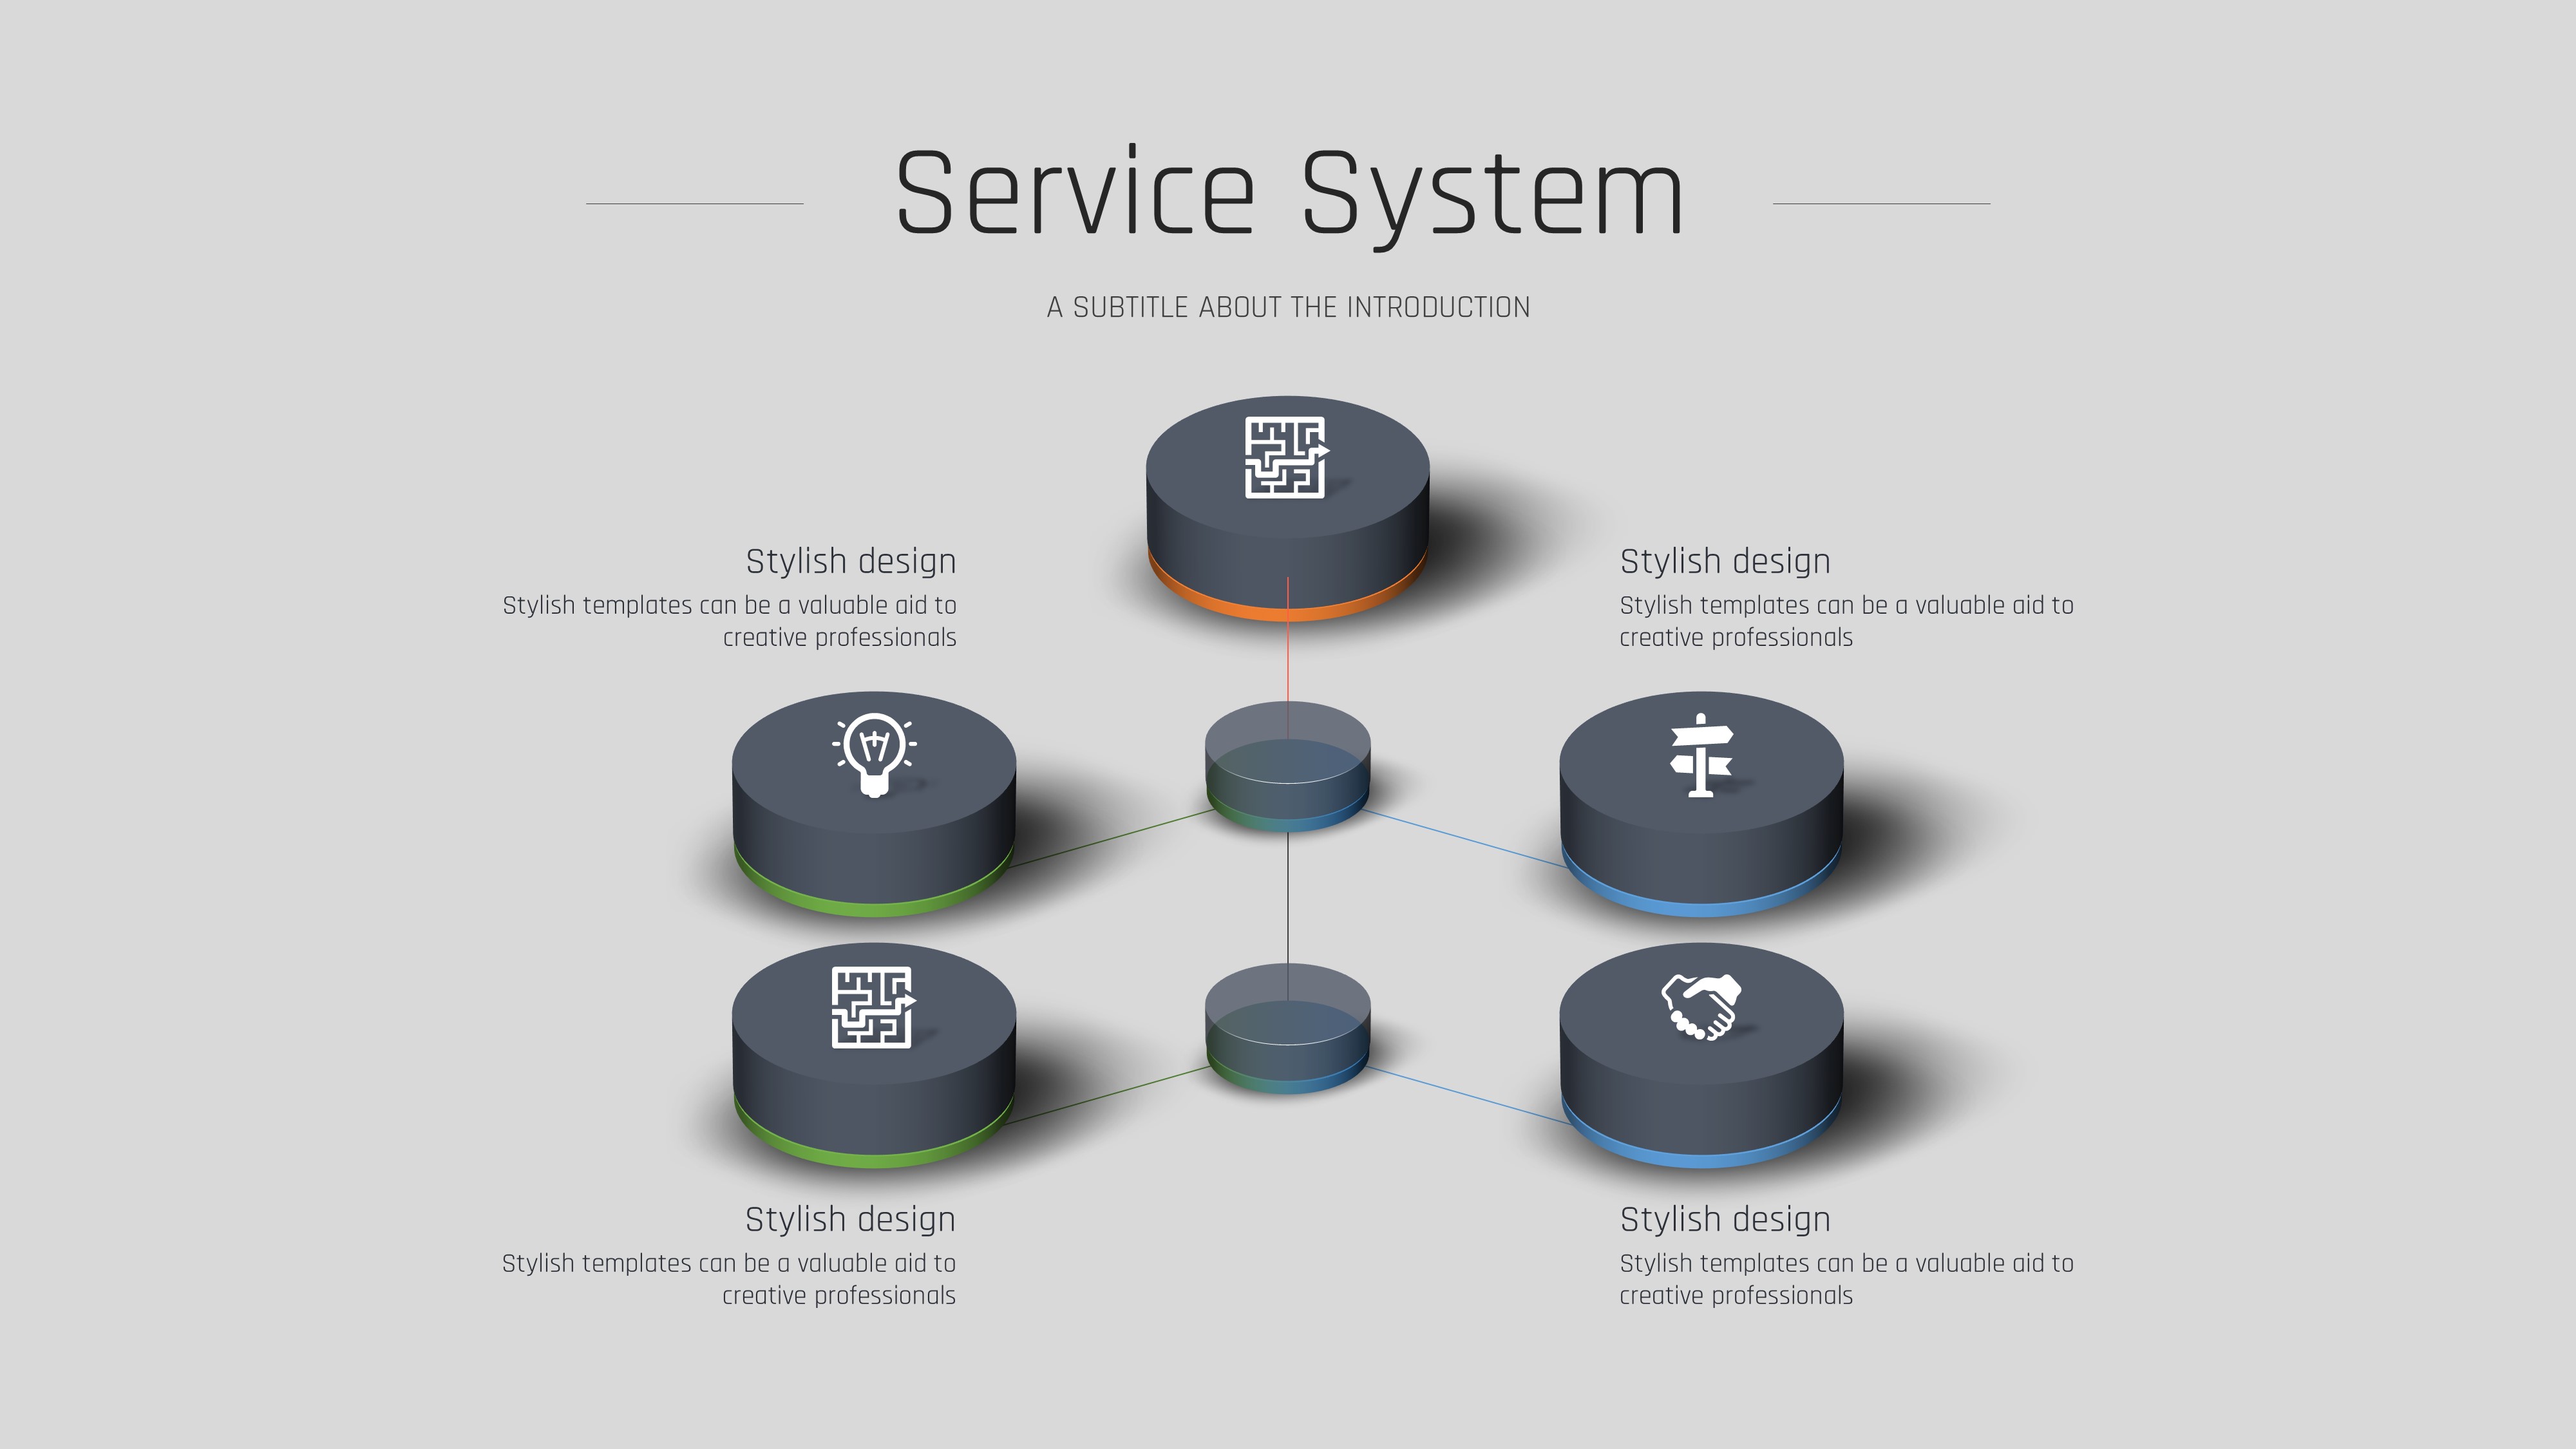
A professional PowerPoint template designed for IT companies and tech-driven businesses, featuring a charcoal gray background with bold orange and blue accent colors. The deck includes 3D cylindrical bar charts, hexagonal step-by-step process diagrams, layered stack infographics, and icon-based grid layouts — all built to communicate complex workflows and service structures with visual clarity. With 35 fully editable slides in 16:9 widescreen PPTX format, this presentation template covers everything from a photo-background cover slide to data comparison charts and multi-step process flows. Ideal for startup pitches, IT service launches, internal business reports, and client proposals. All text, colors, and icons can be freely customized to match your brand identity.
Usage Points
-
Main Usage
Designed to present IT workflows, service architectures, and technology-driven business strategies. The charcoal and orange color scheme delivers a modern, professional tech image suitable for investor meetings, service launches, and internal reporting.
-
How to Use
Open the PPTX file and replace text, numbers, and icons to fit your content. The 3D cylindrical charts and hexagonal diagrams are fully editable — adjust step counts, colors, and labels to match your specific presentation structure without any design tools.
-
Recommended For
Best suited for IT managers, startup founders, product leads, and business consultants who need a polished, tech-focused slide deck. Perfect for investor pitches, client proposals, service introduction decks, and team briefings in technology-related fields.
-
Slide Structure
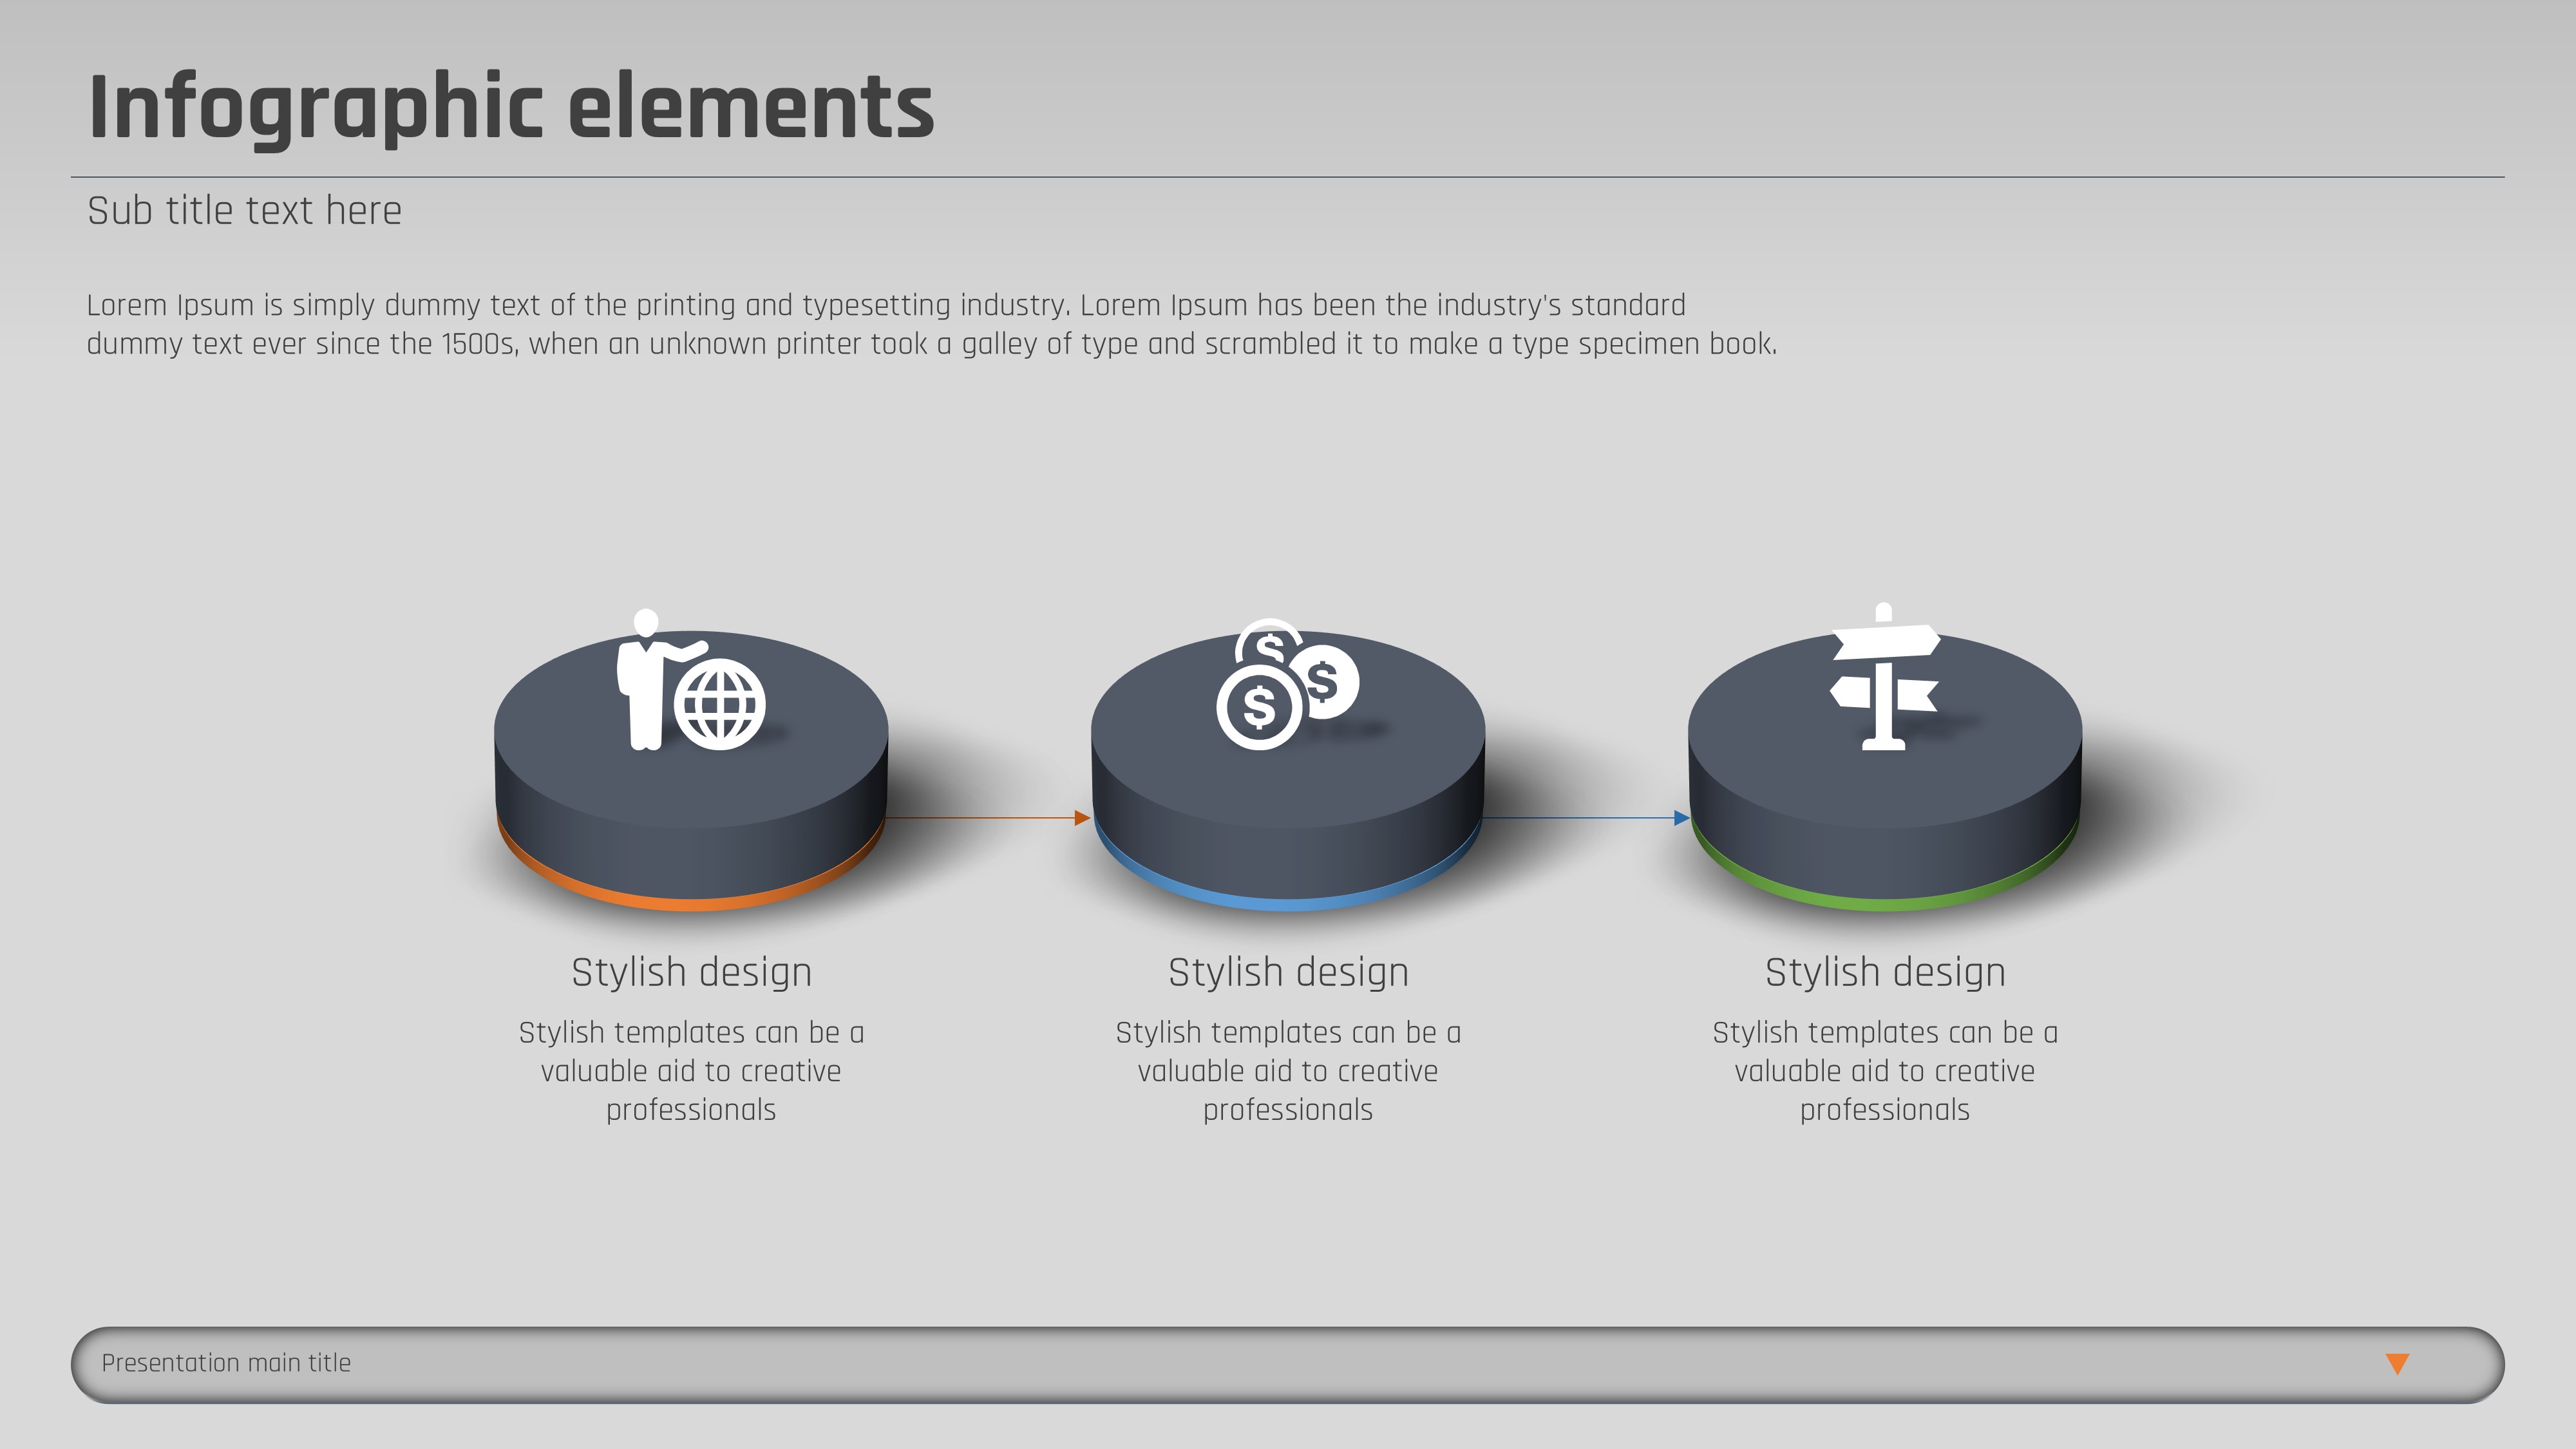
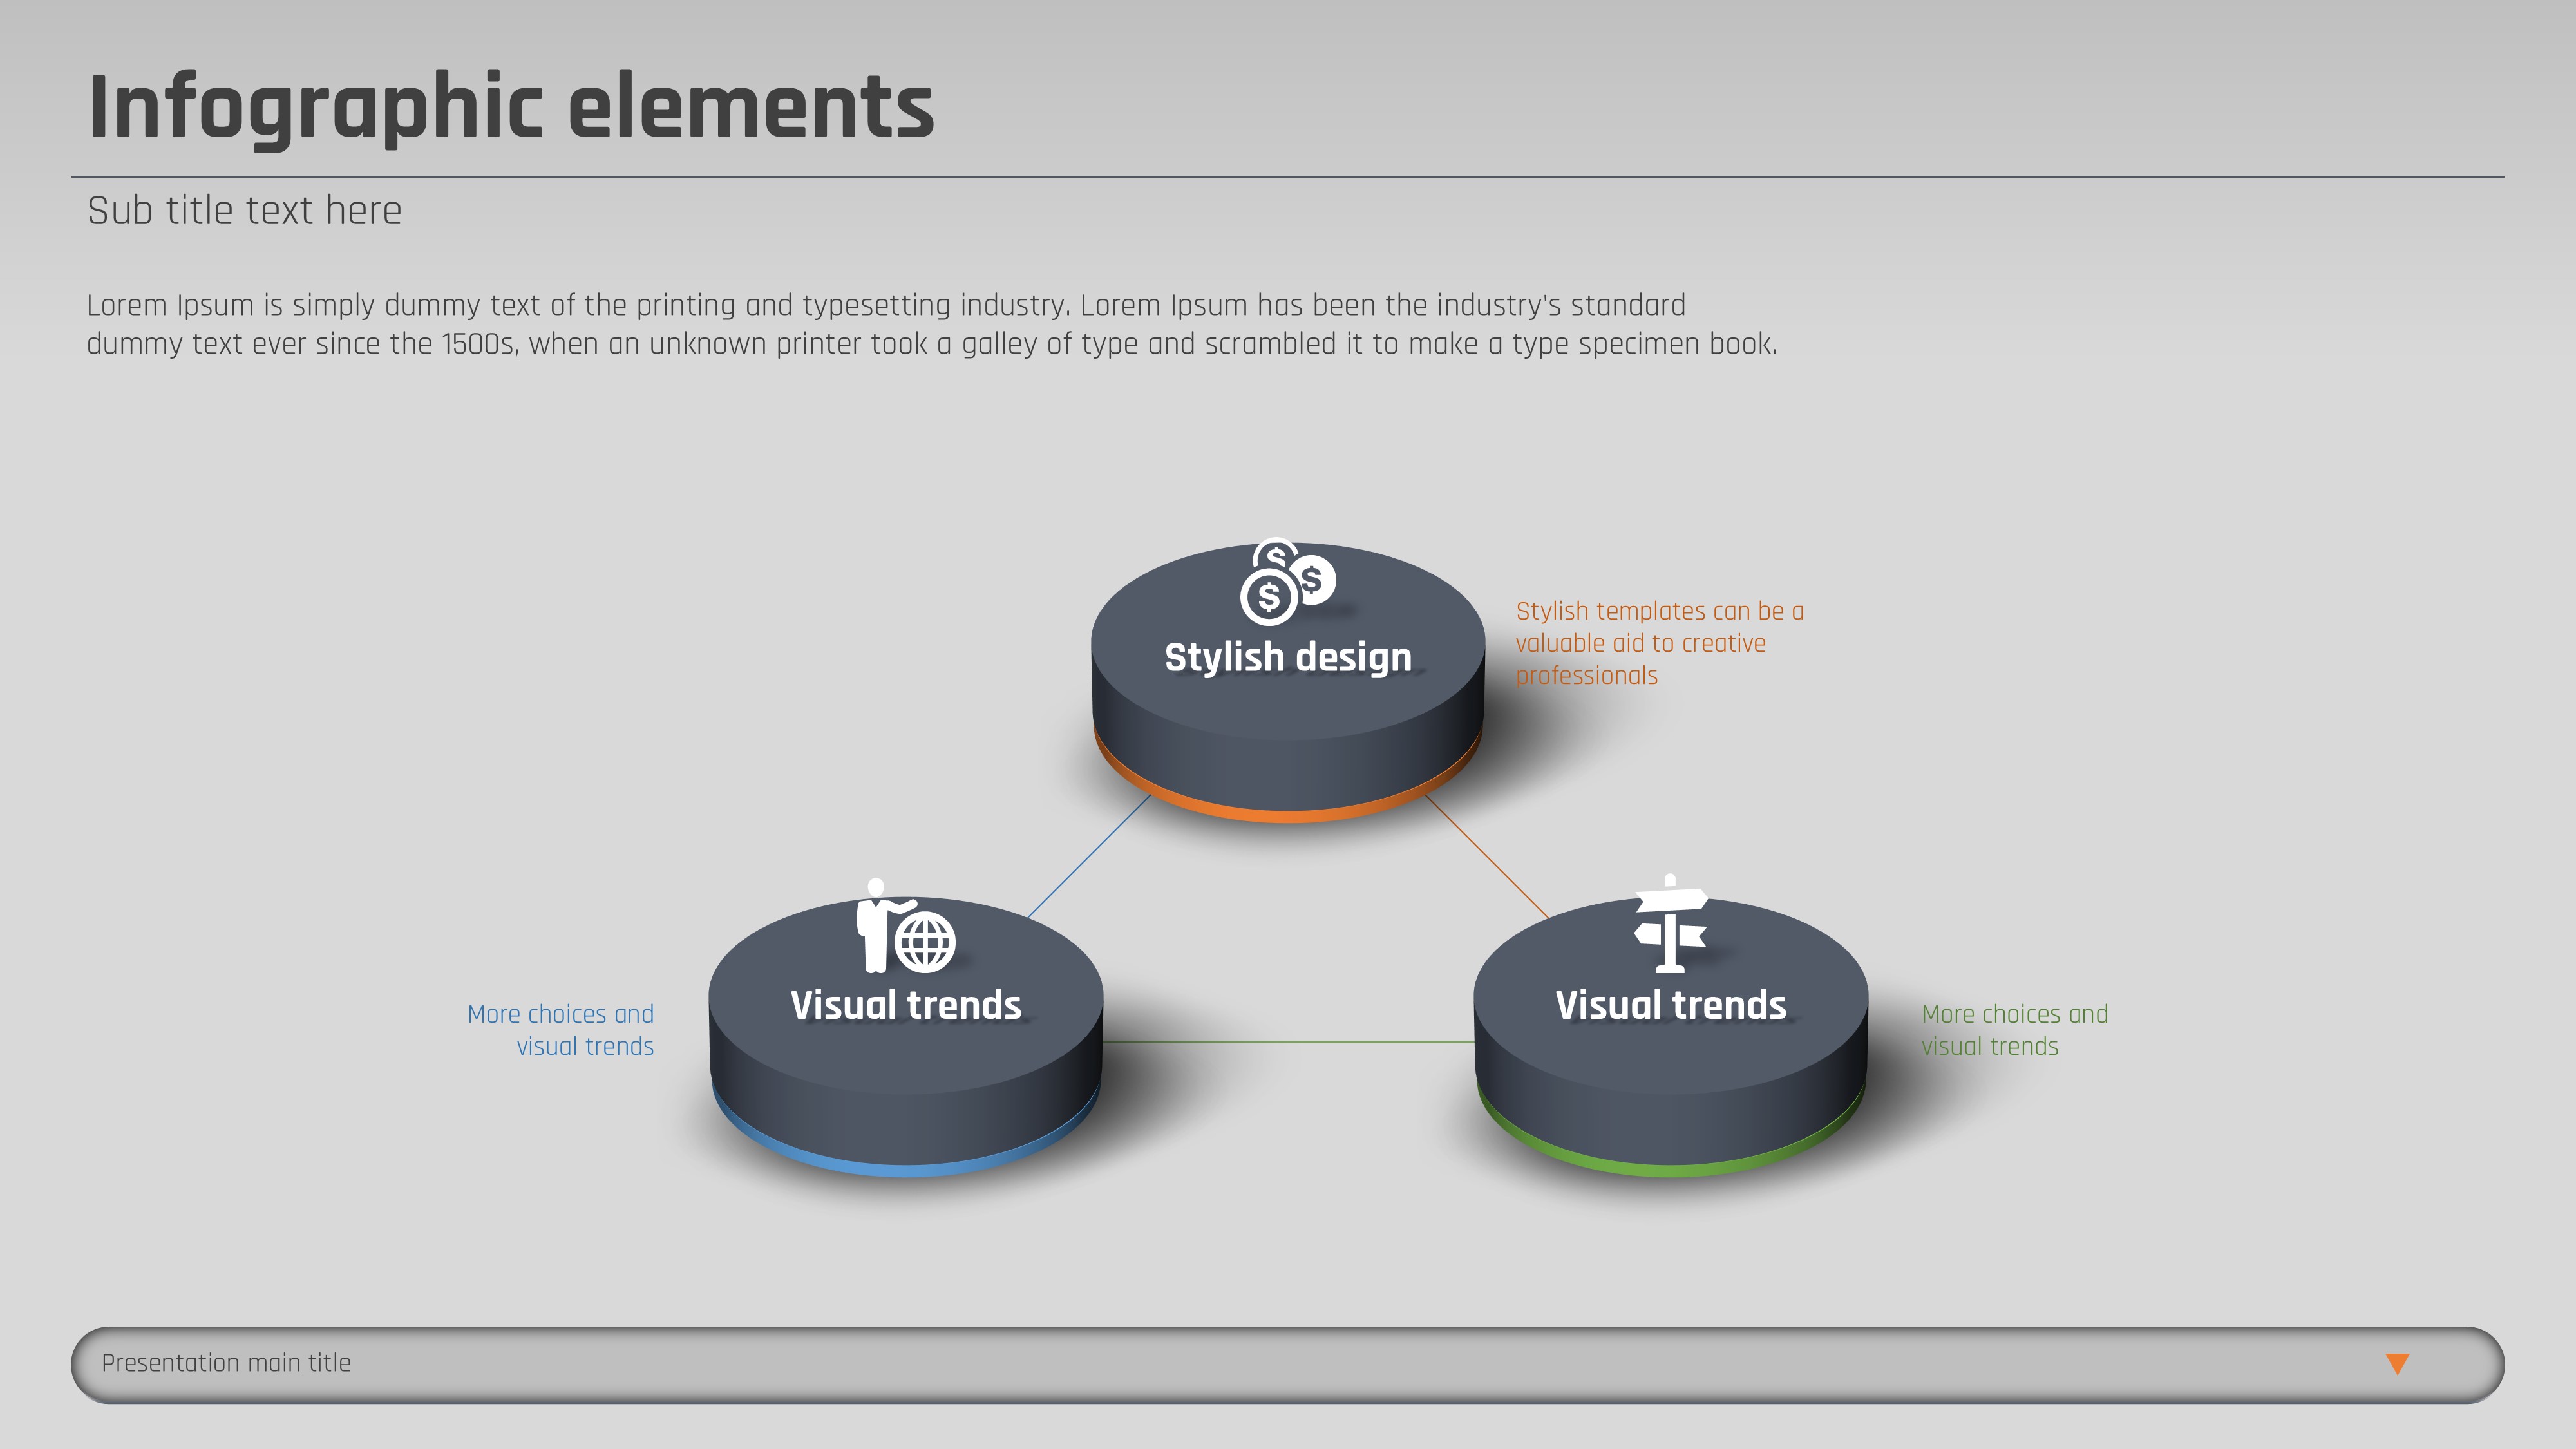
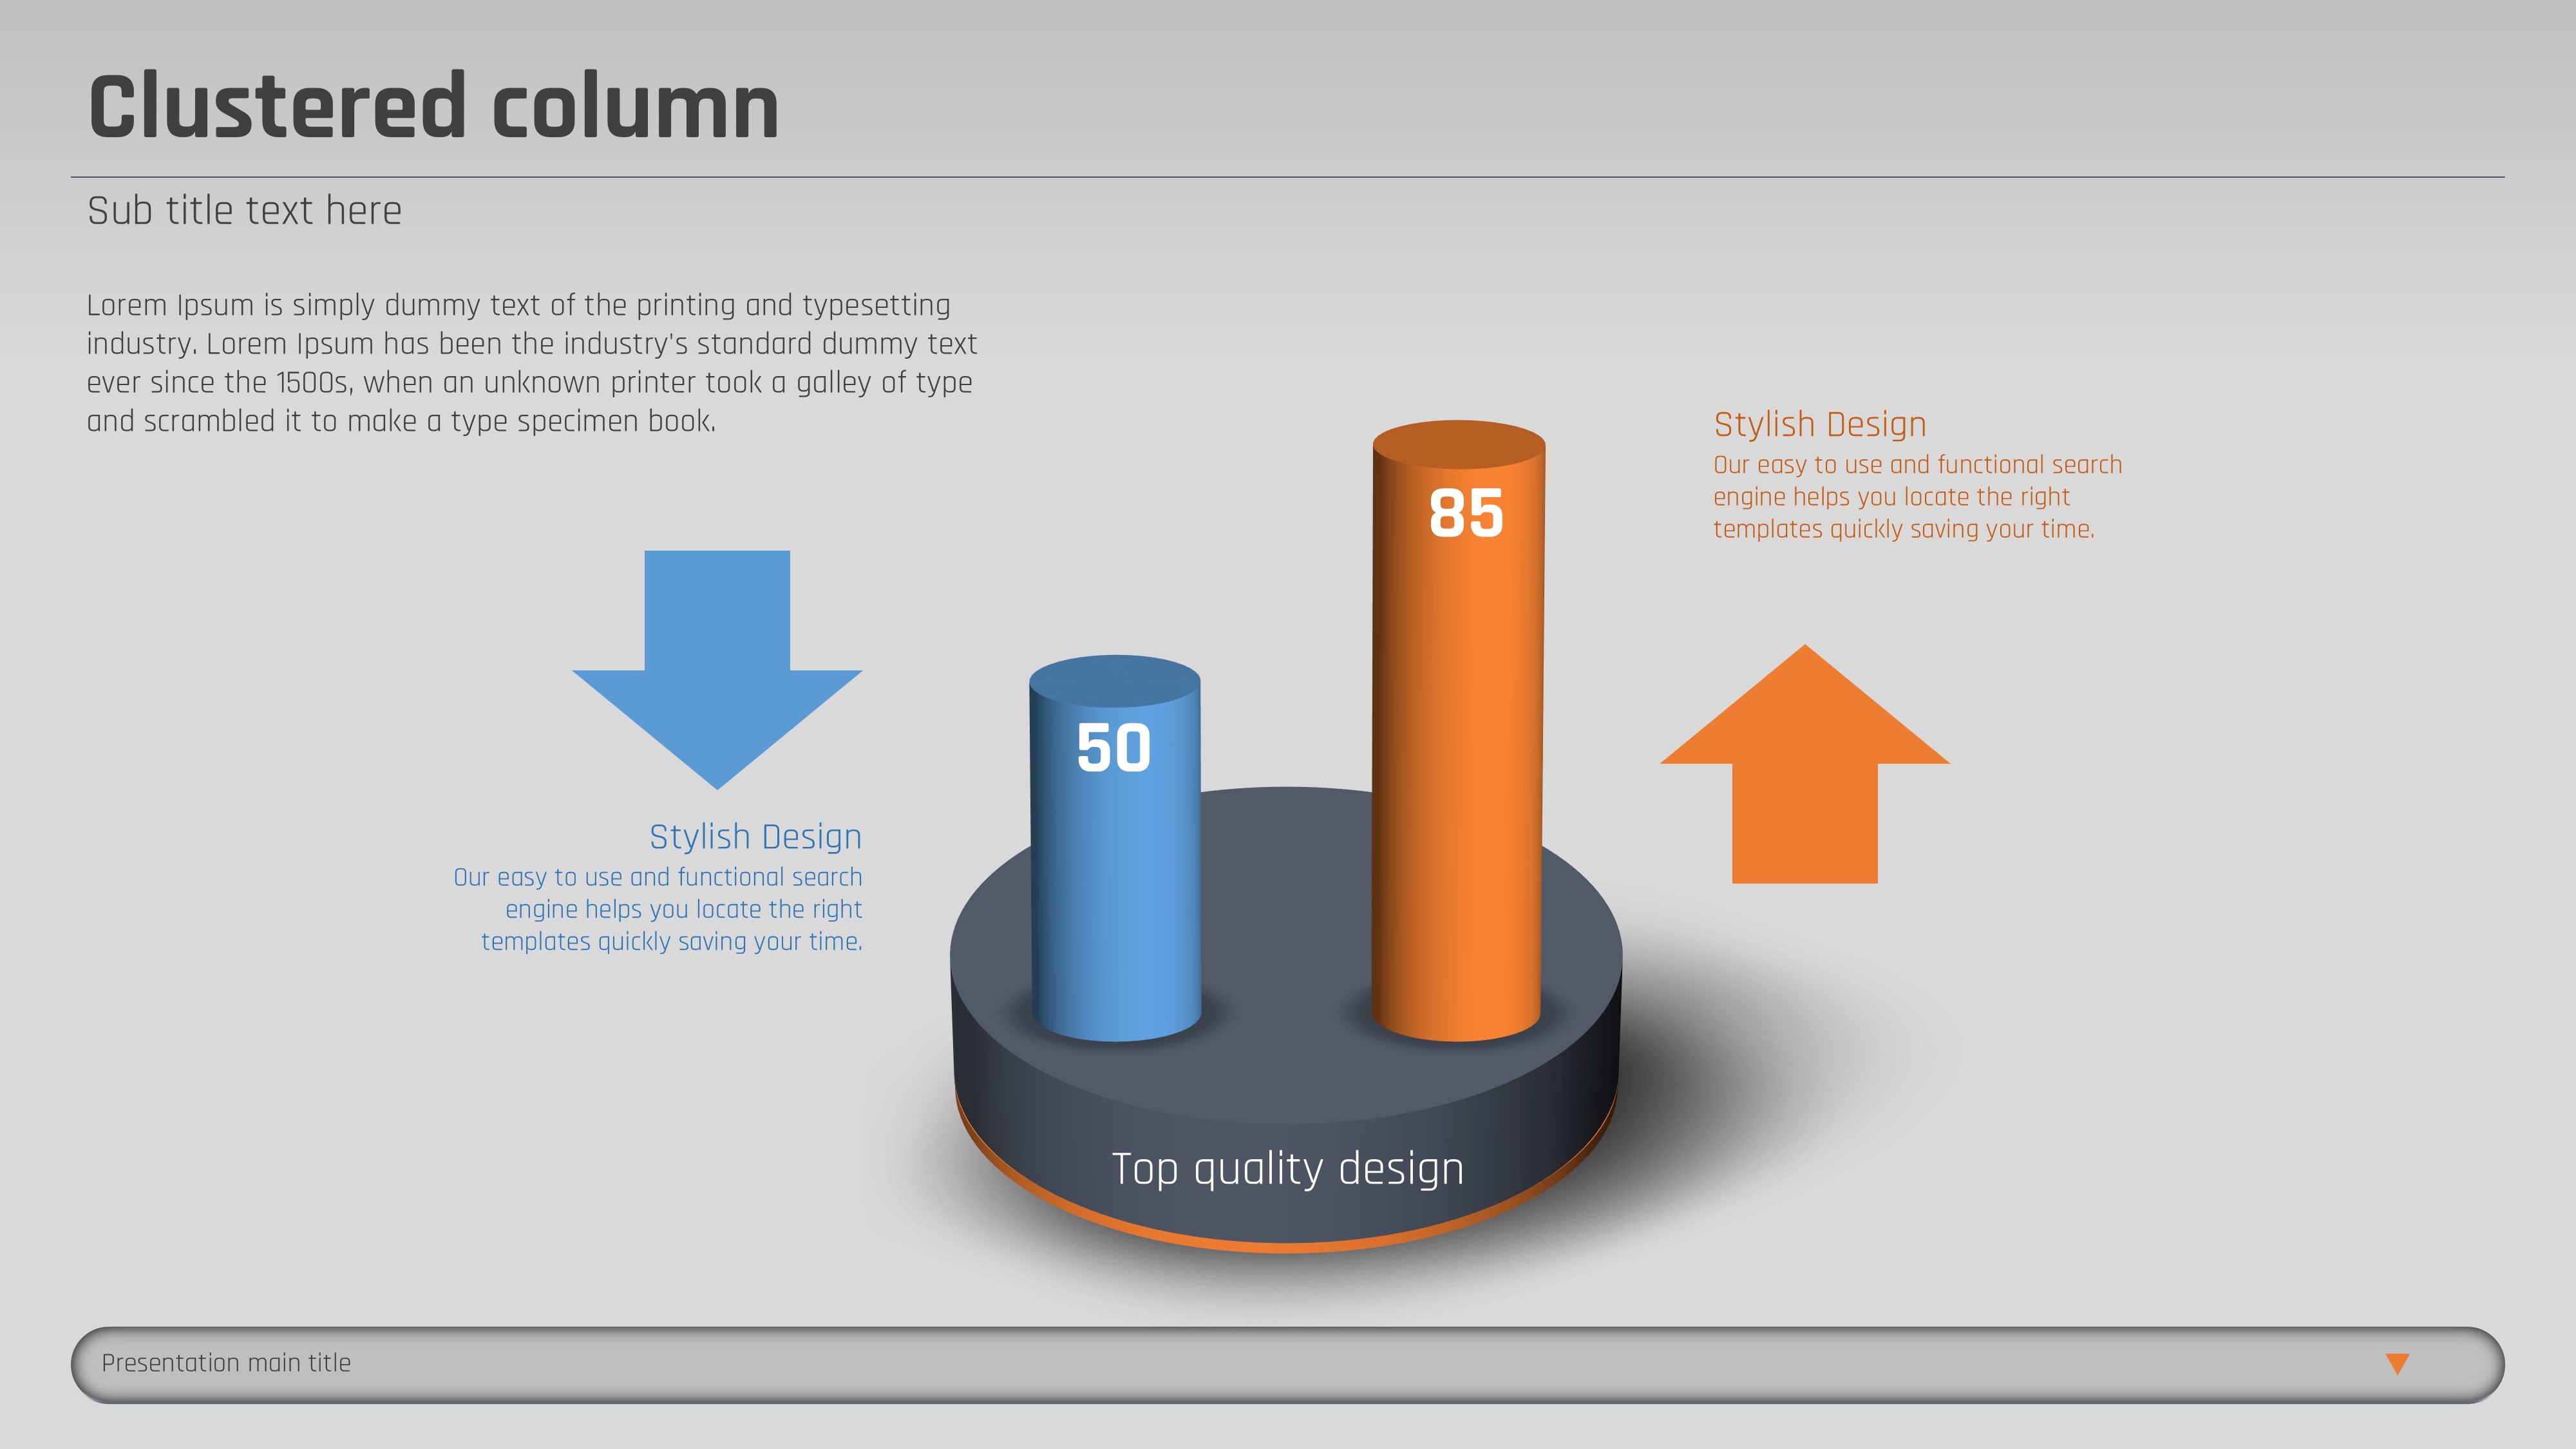
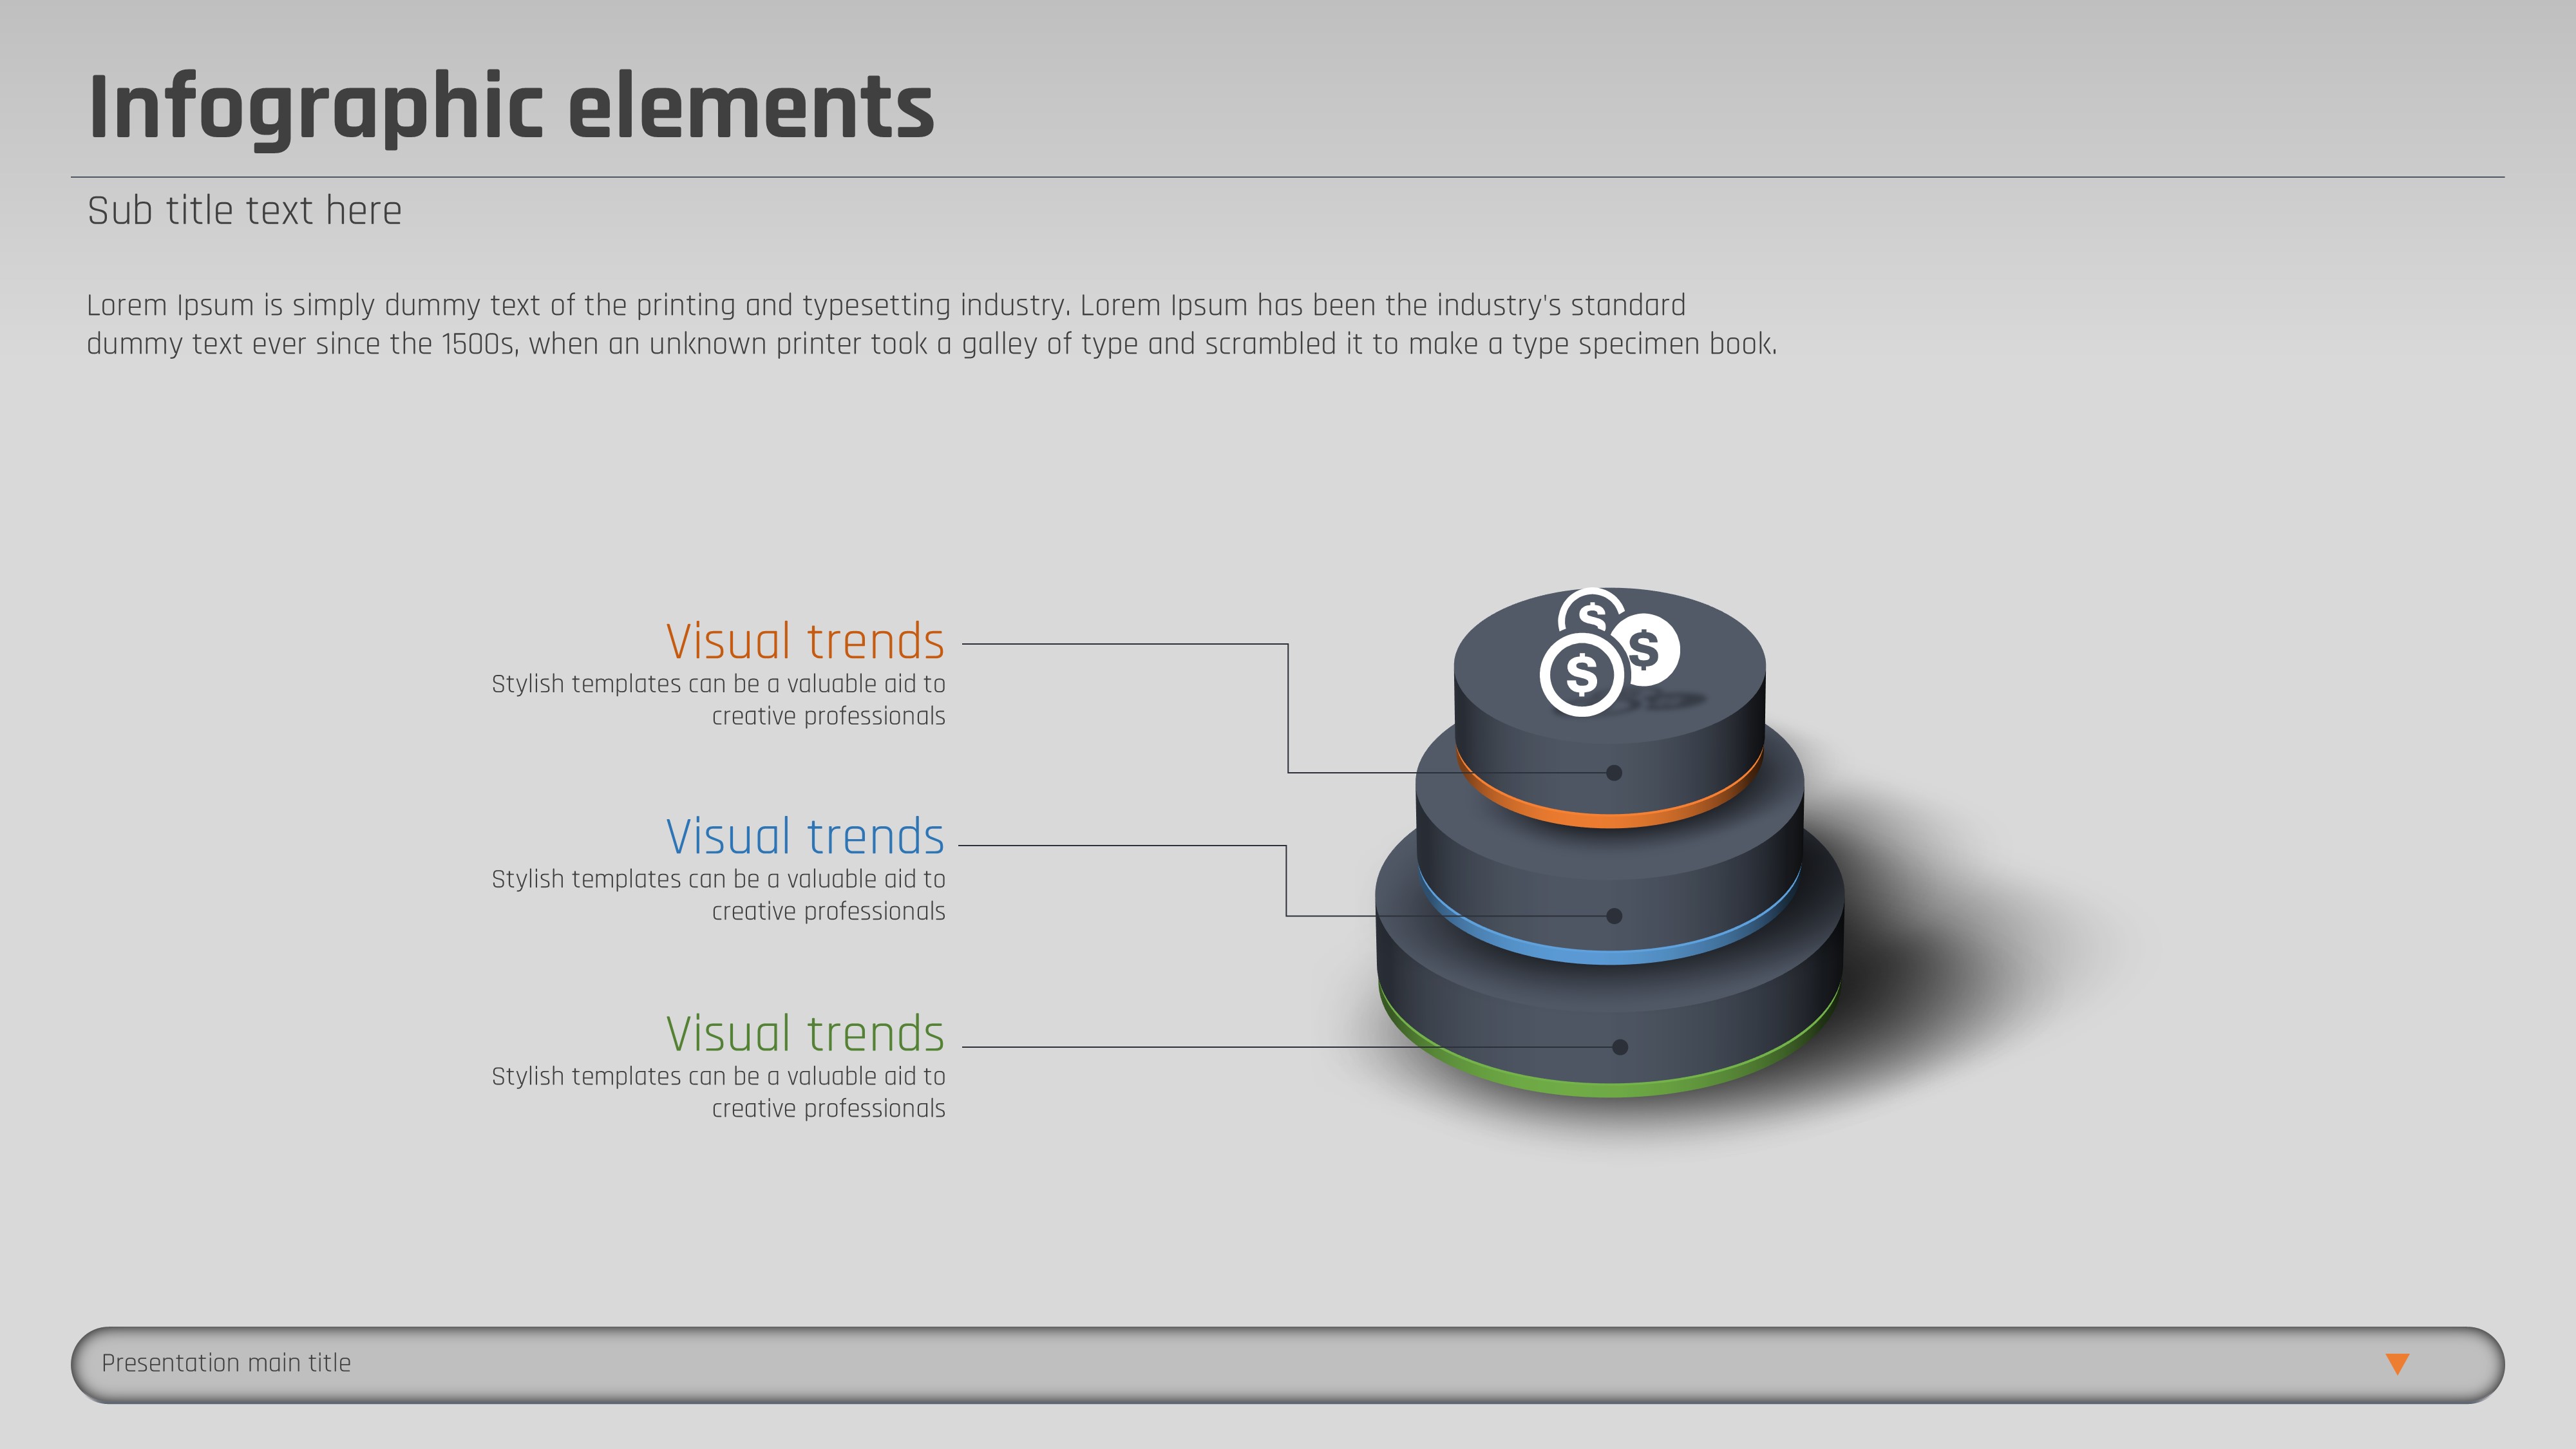
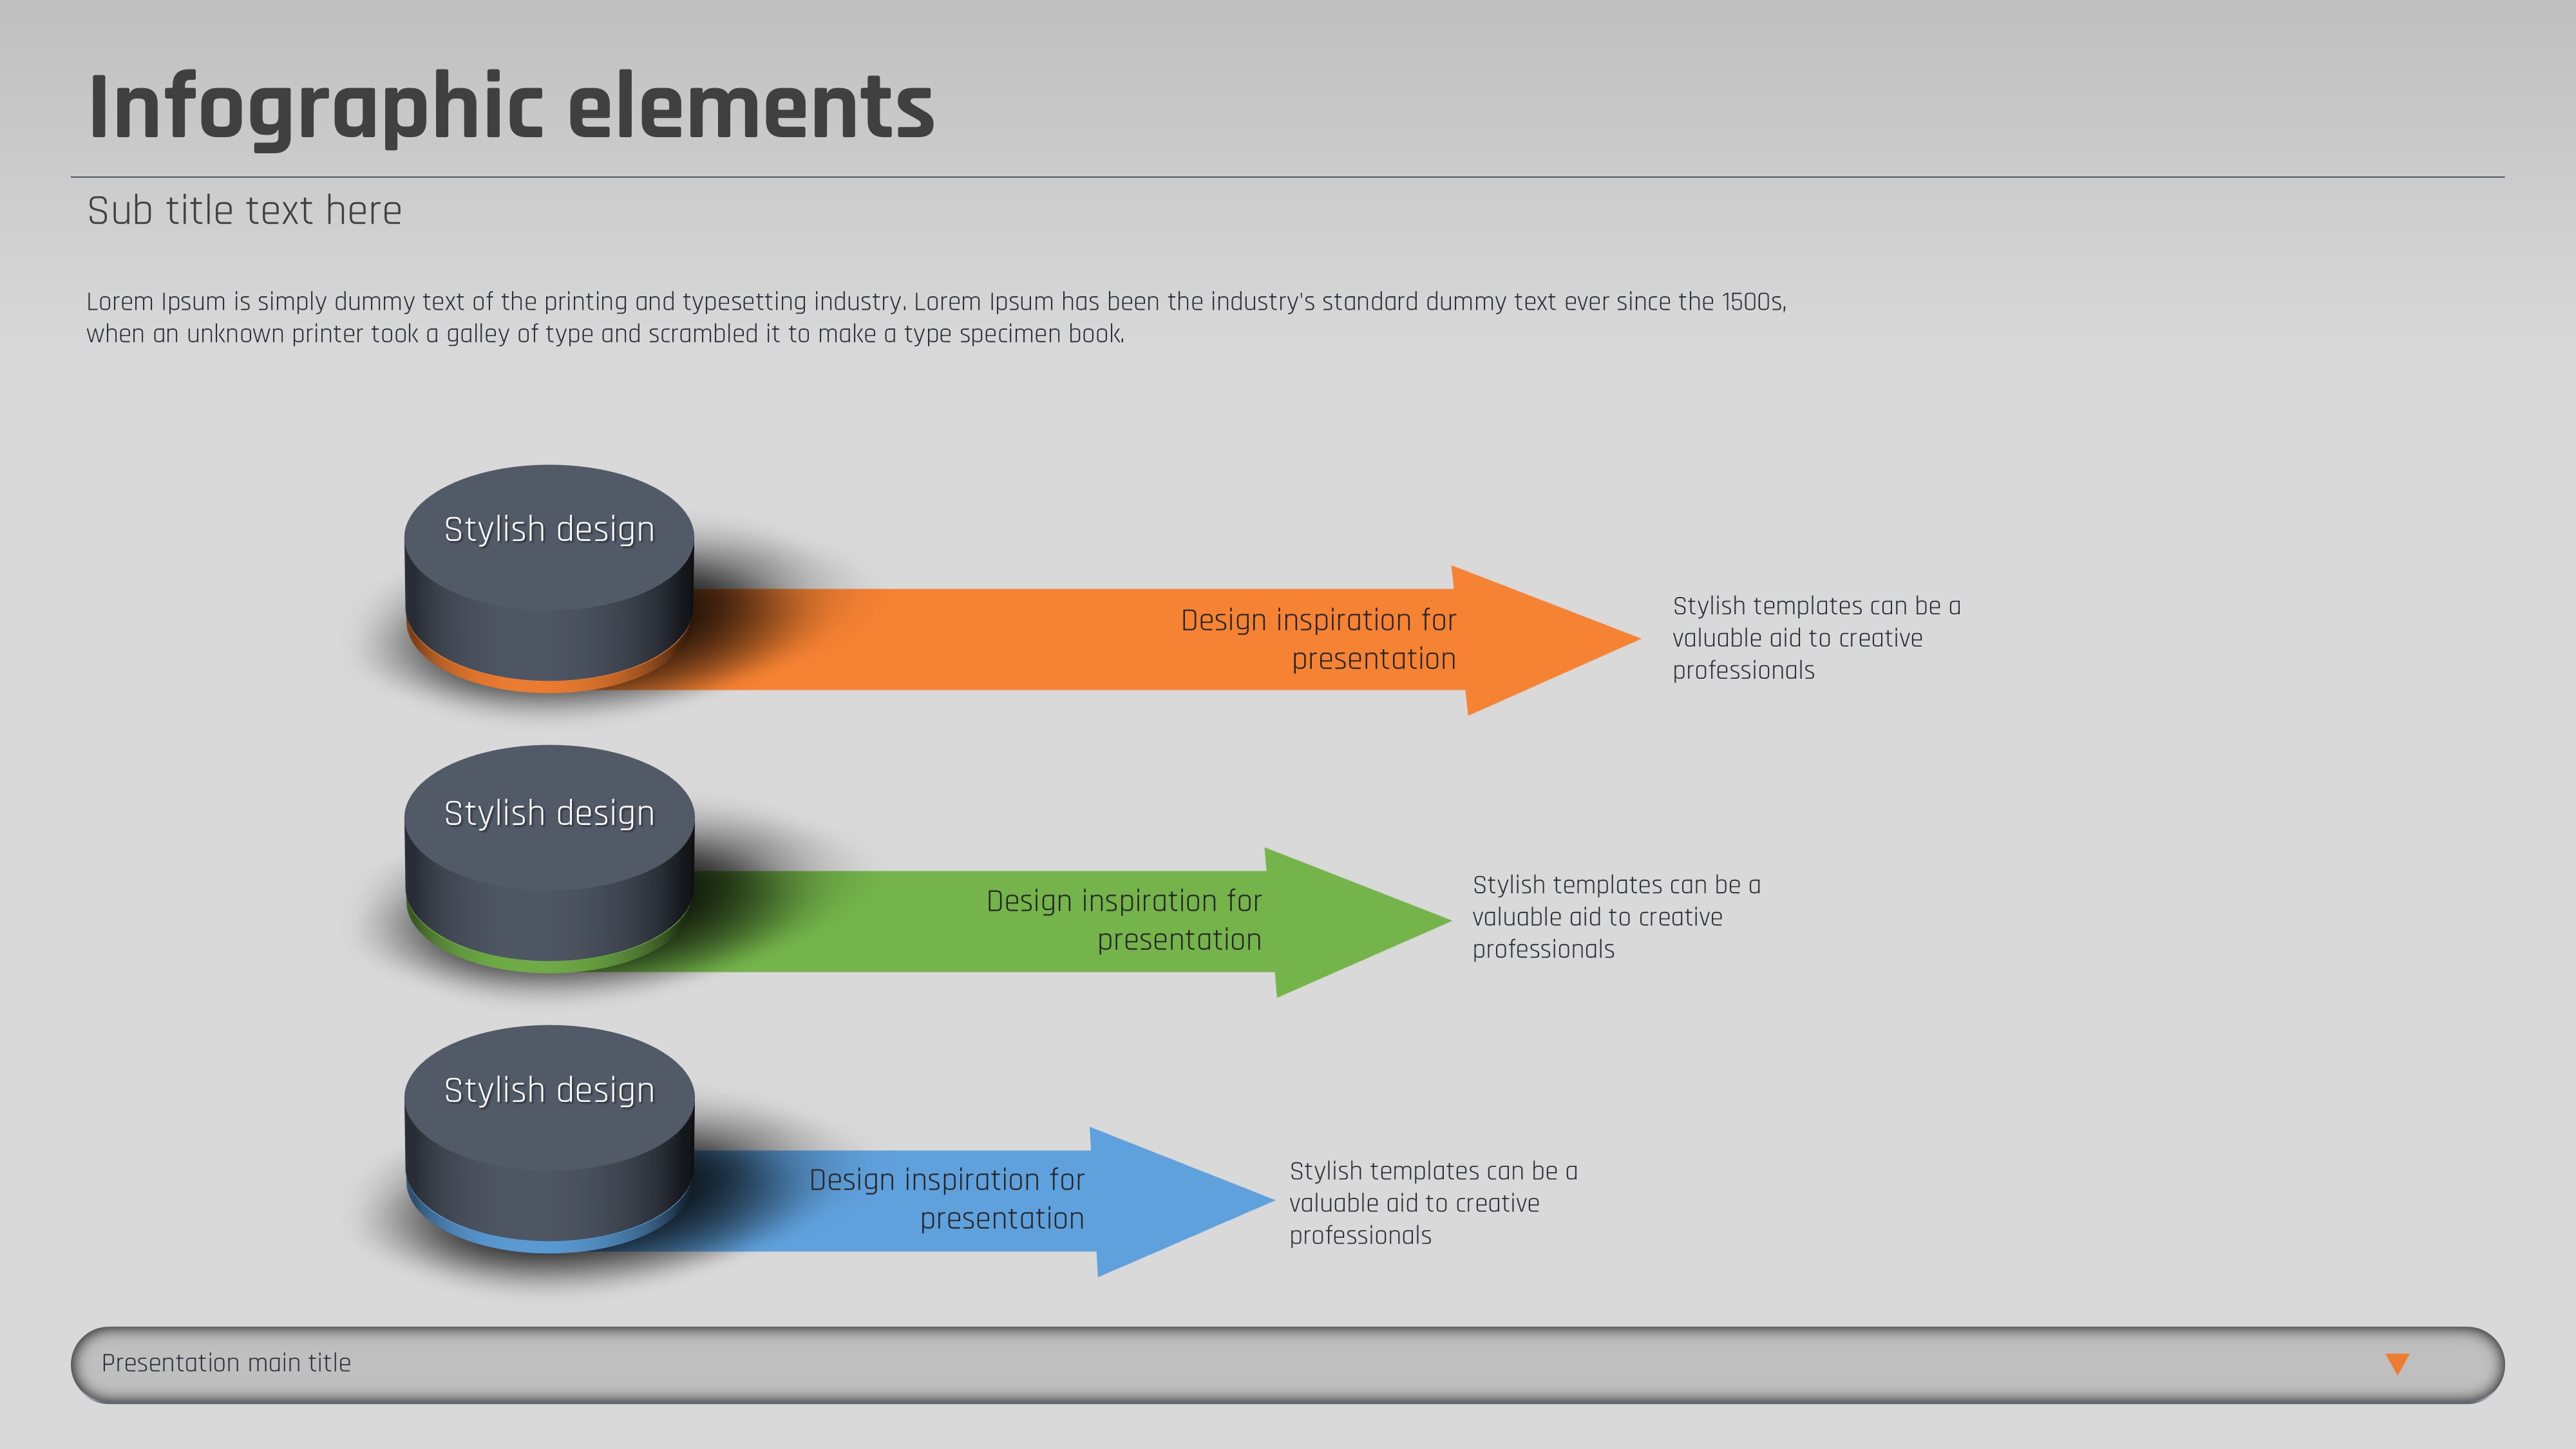
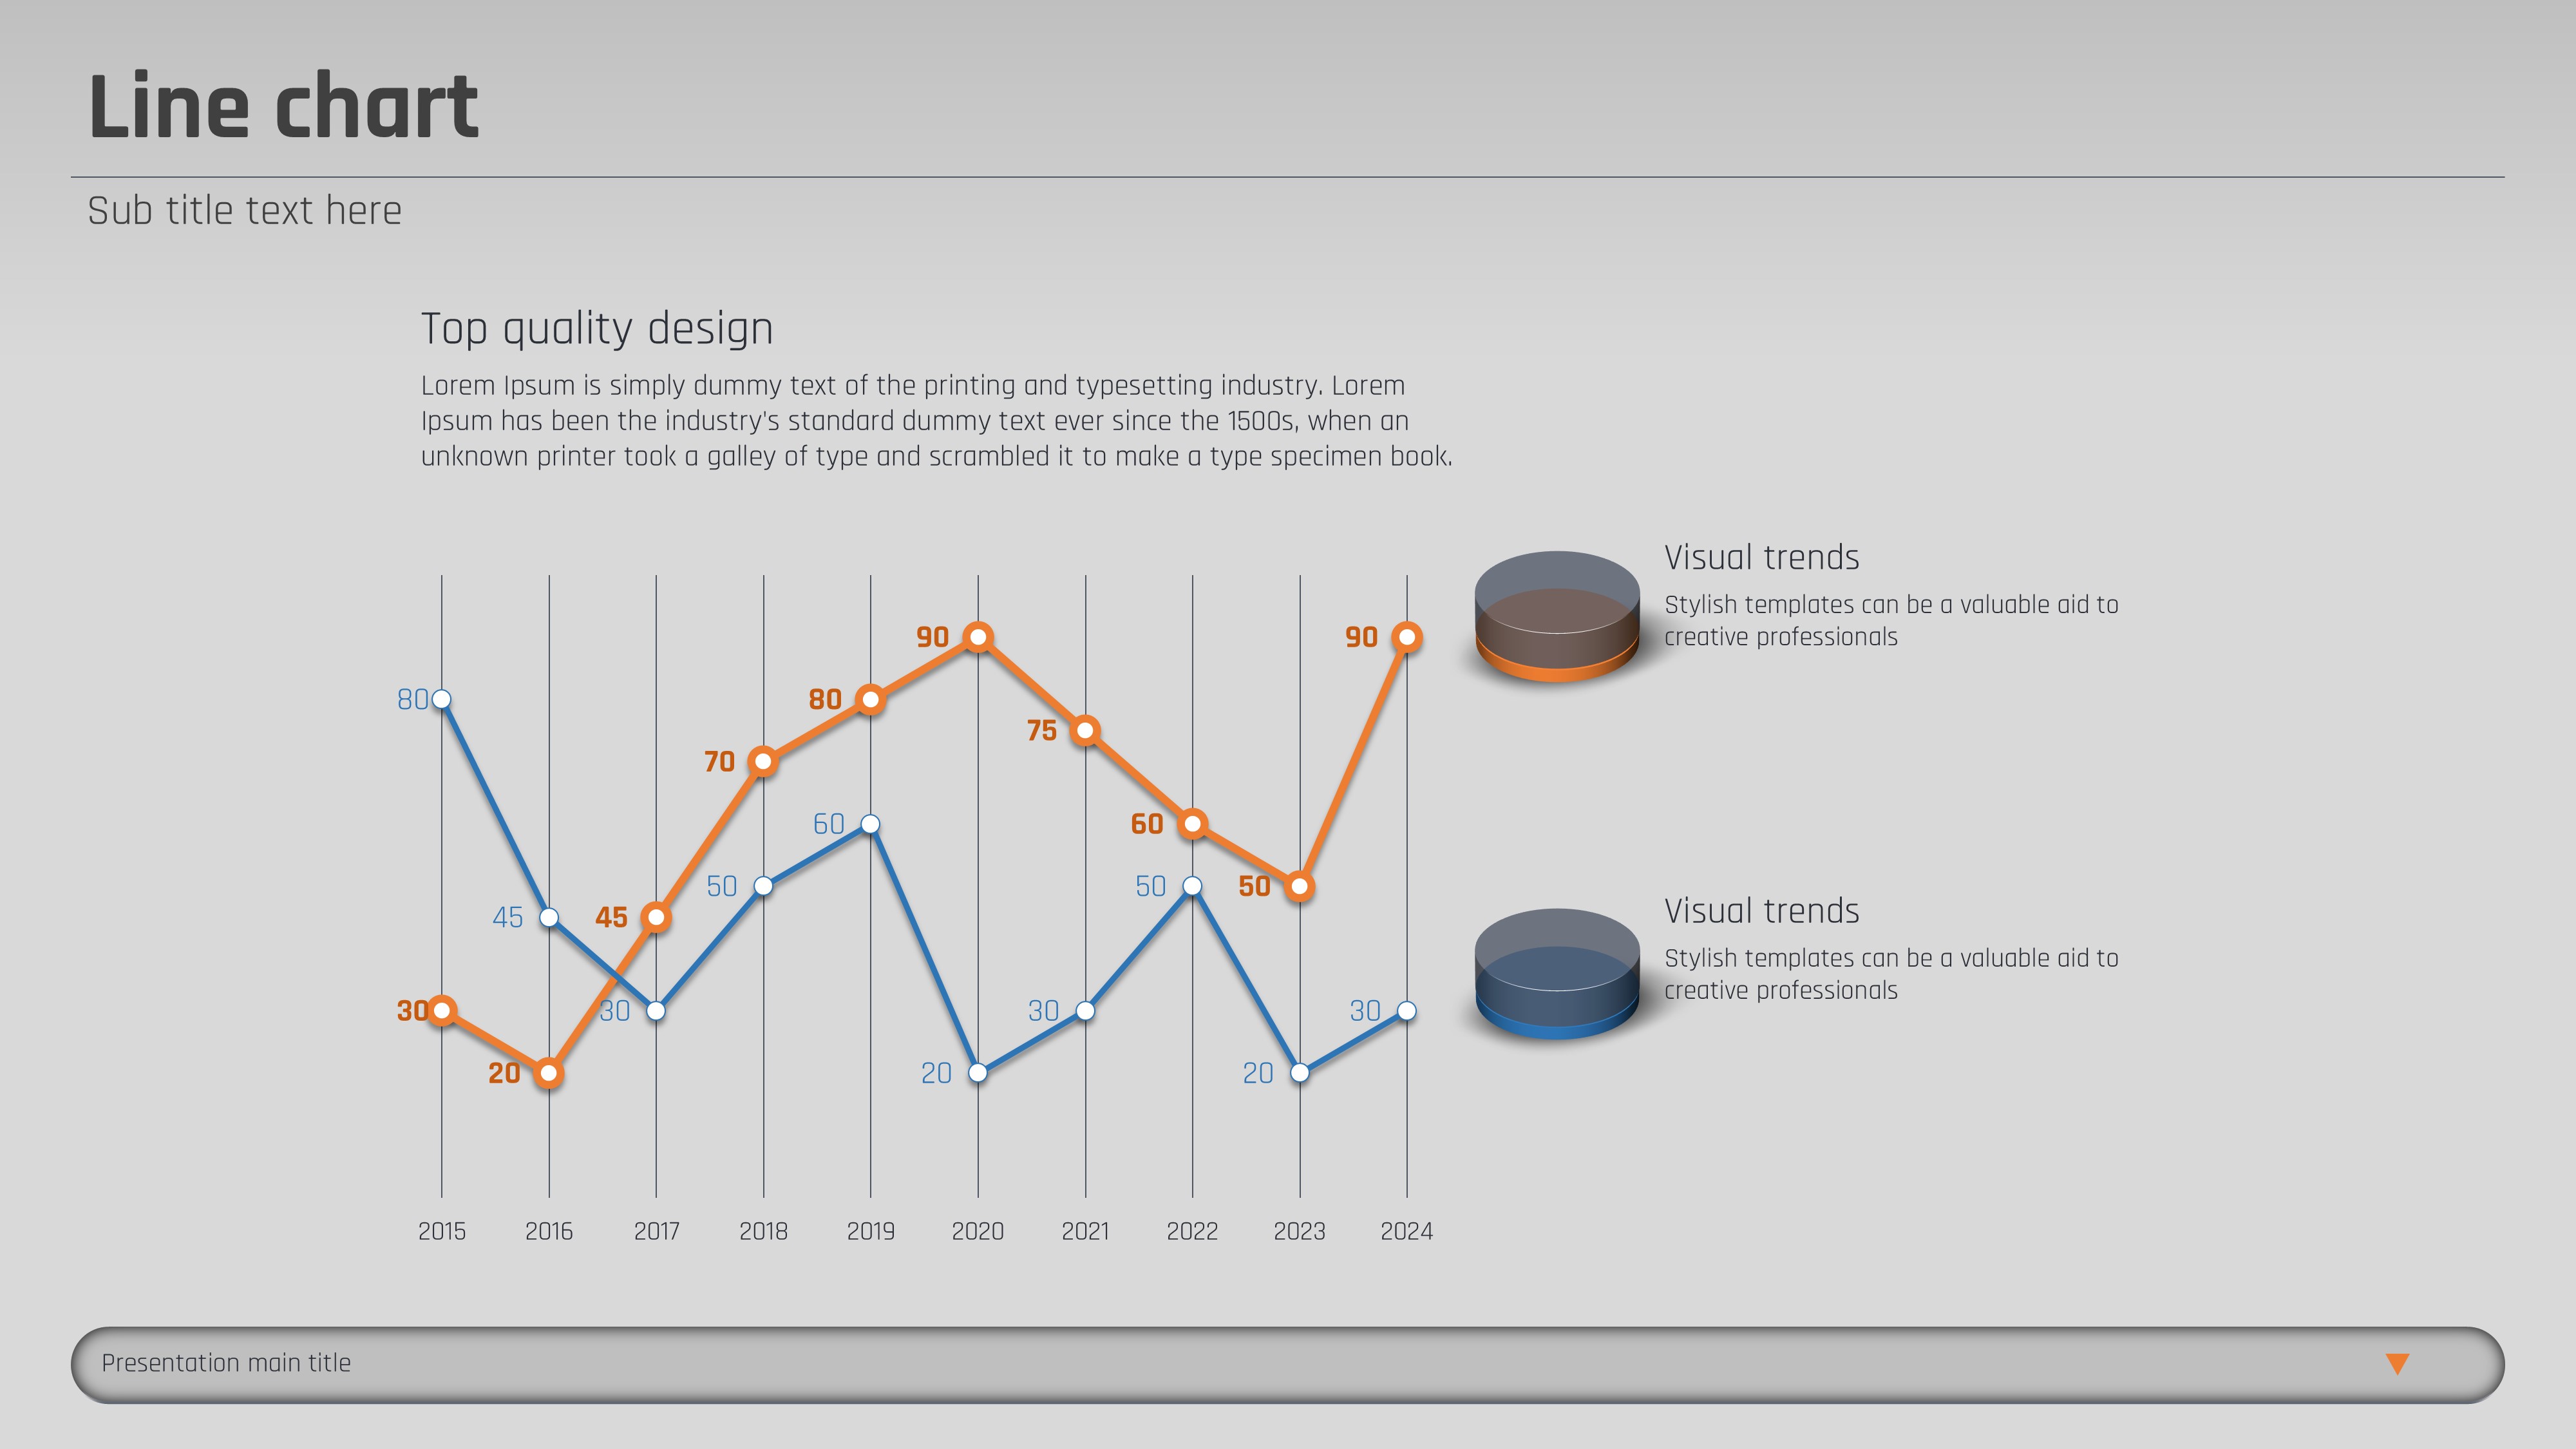
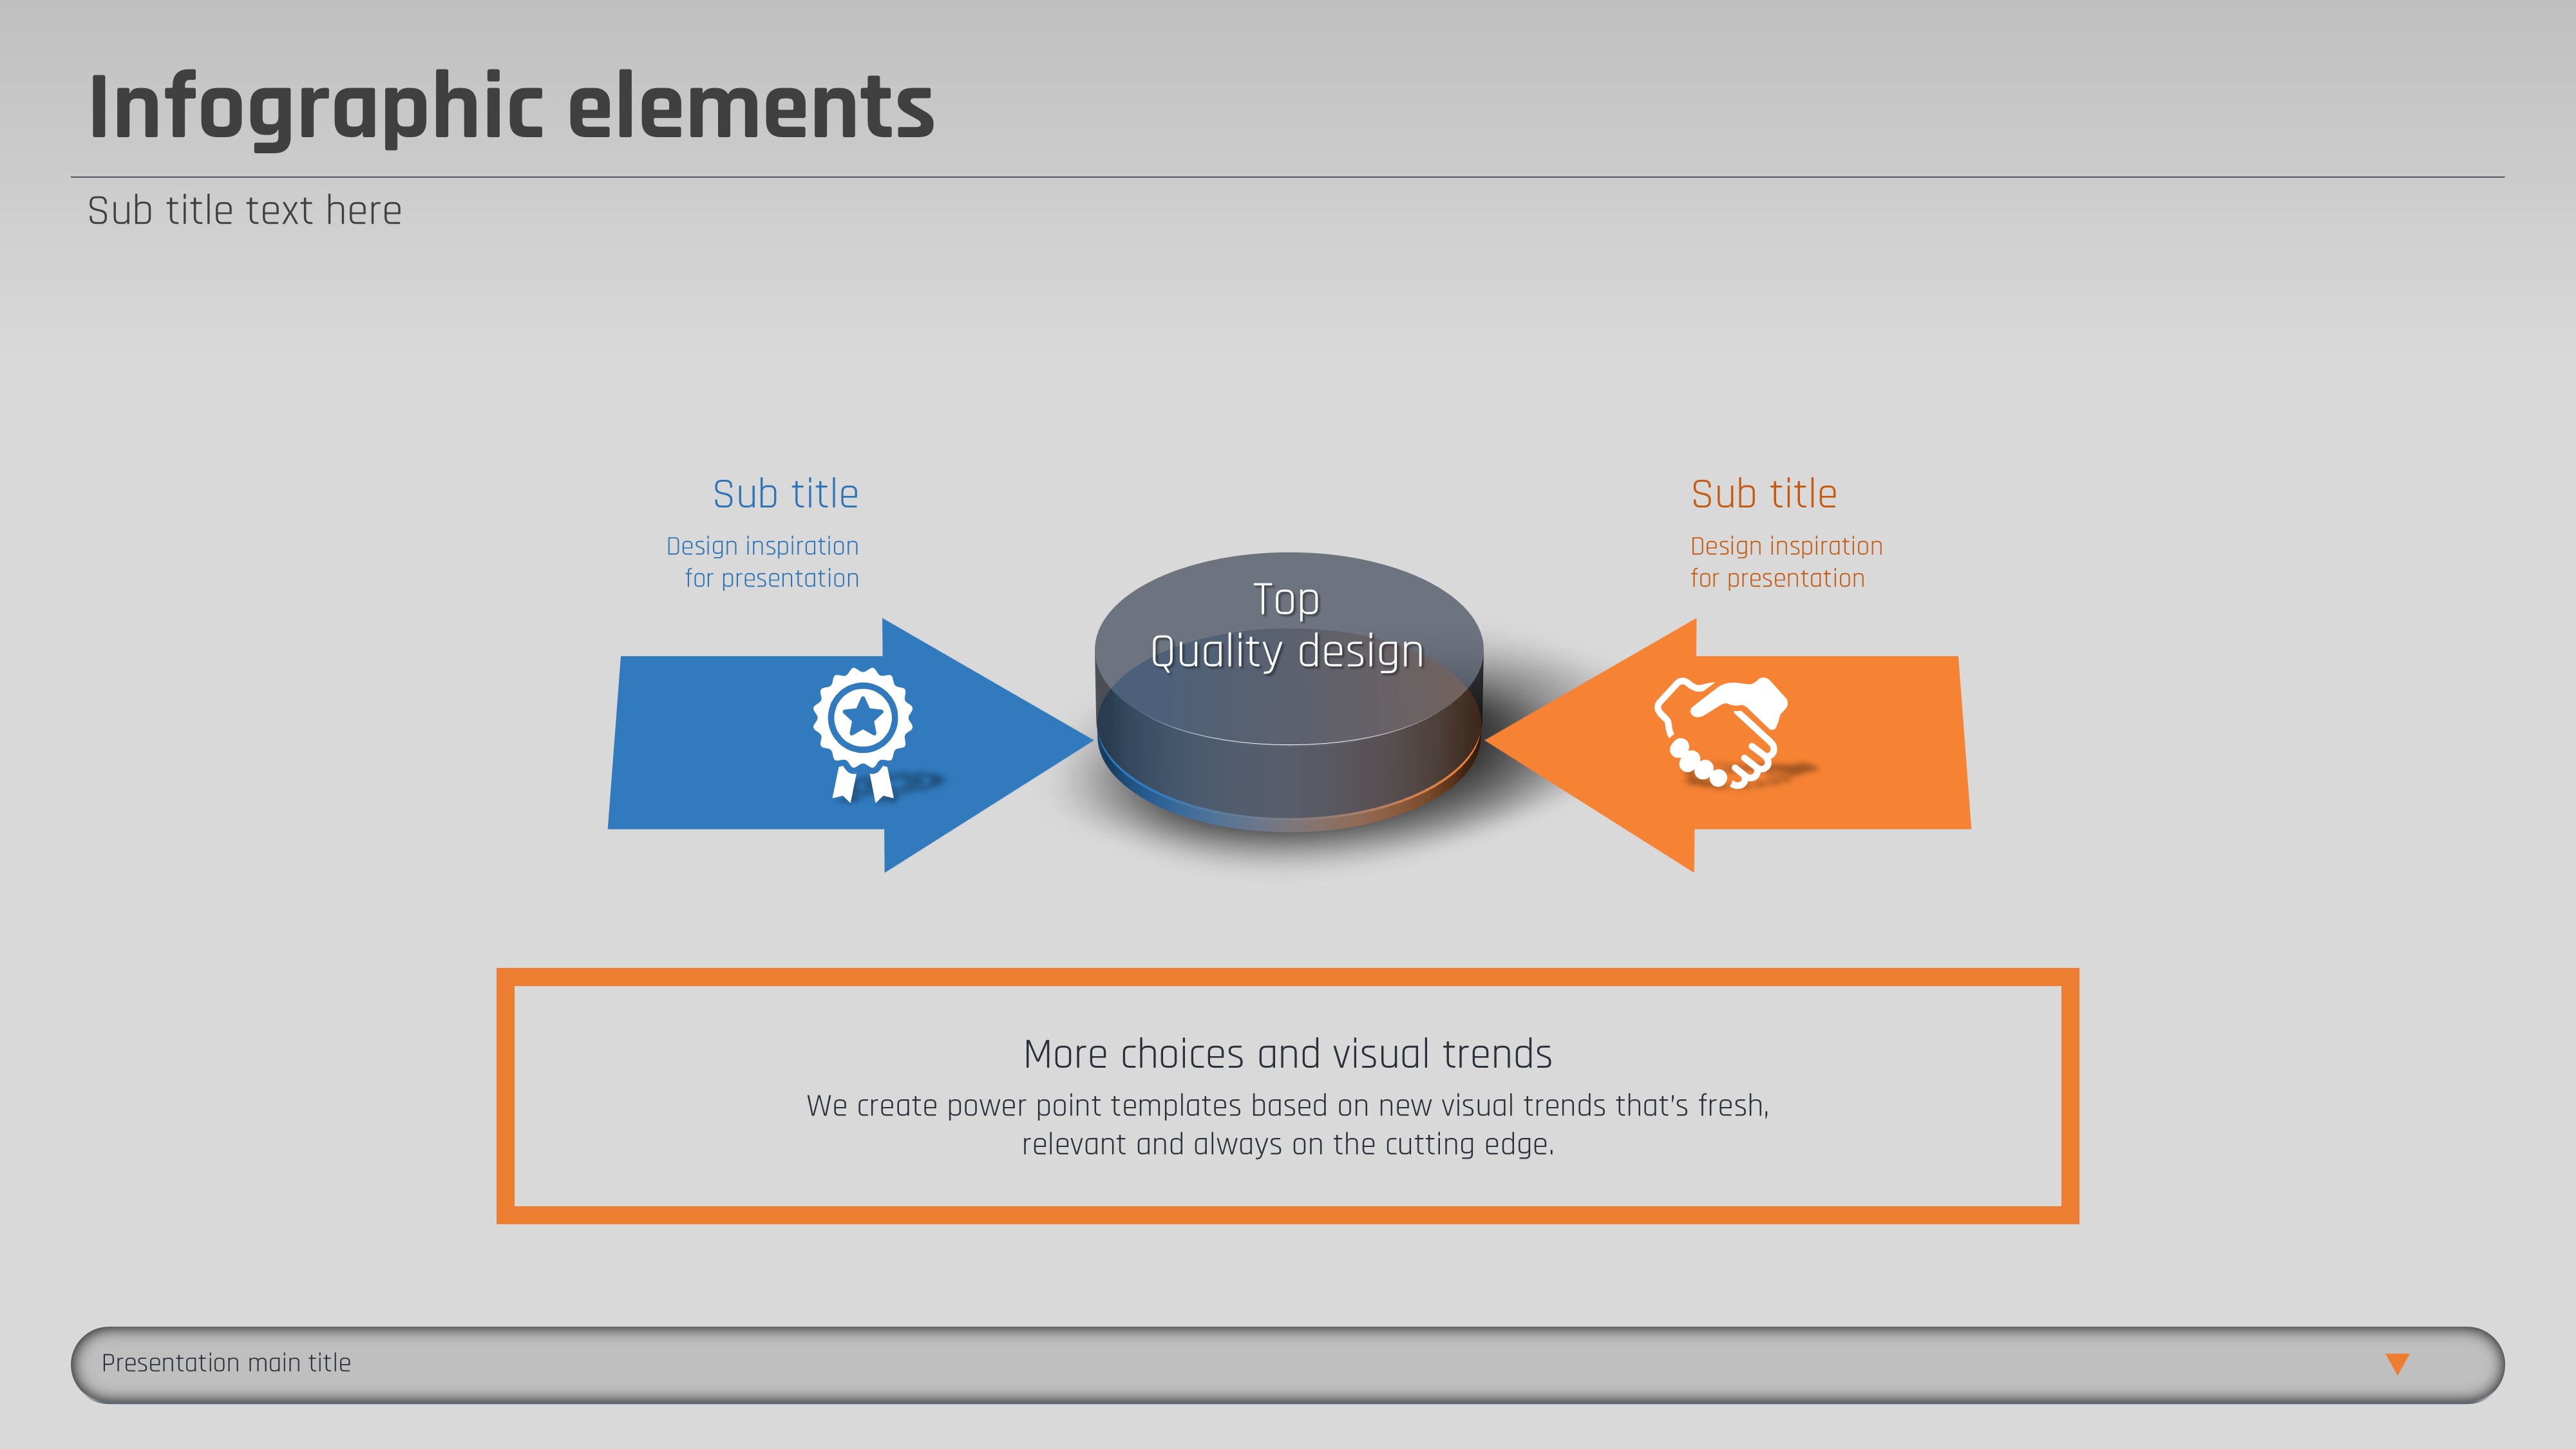
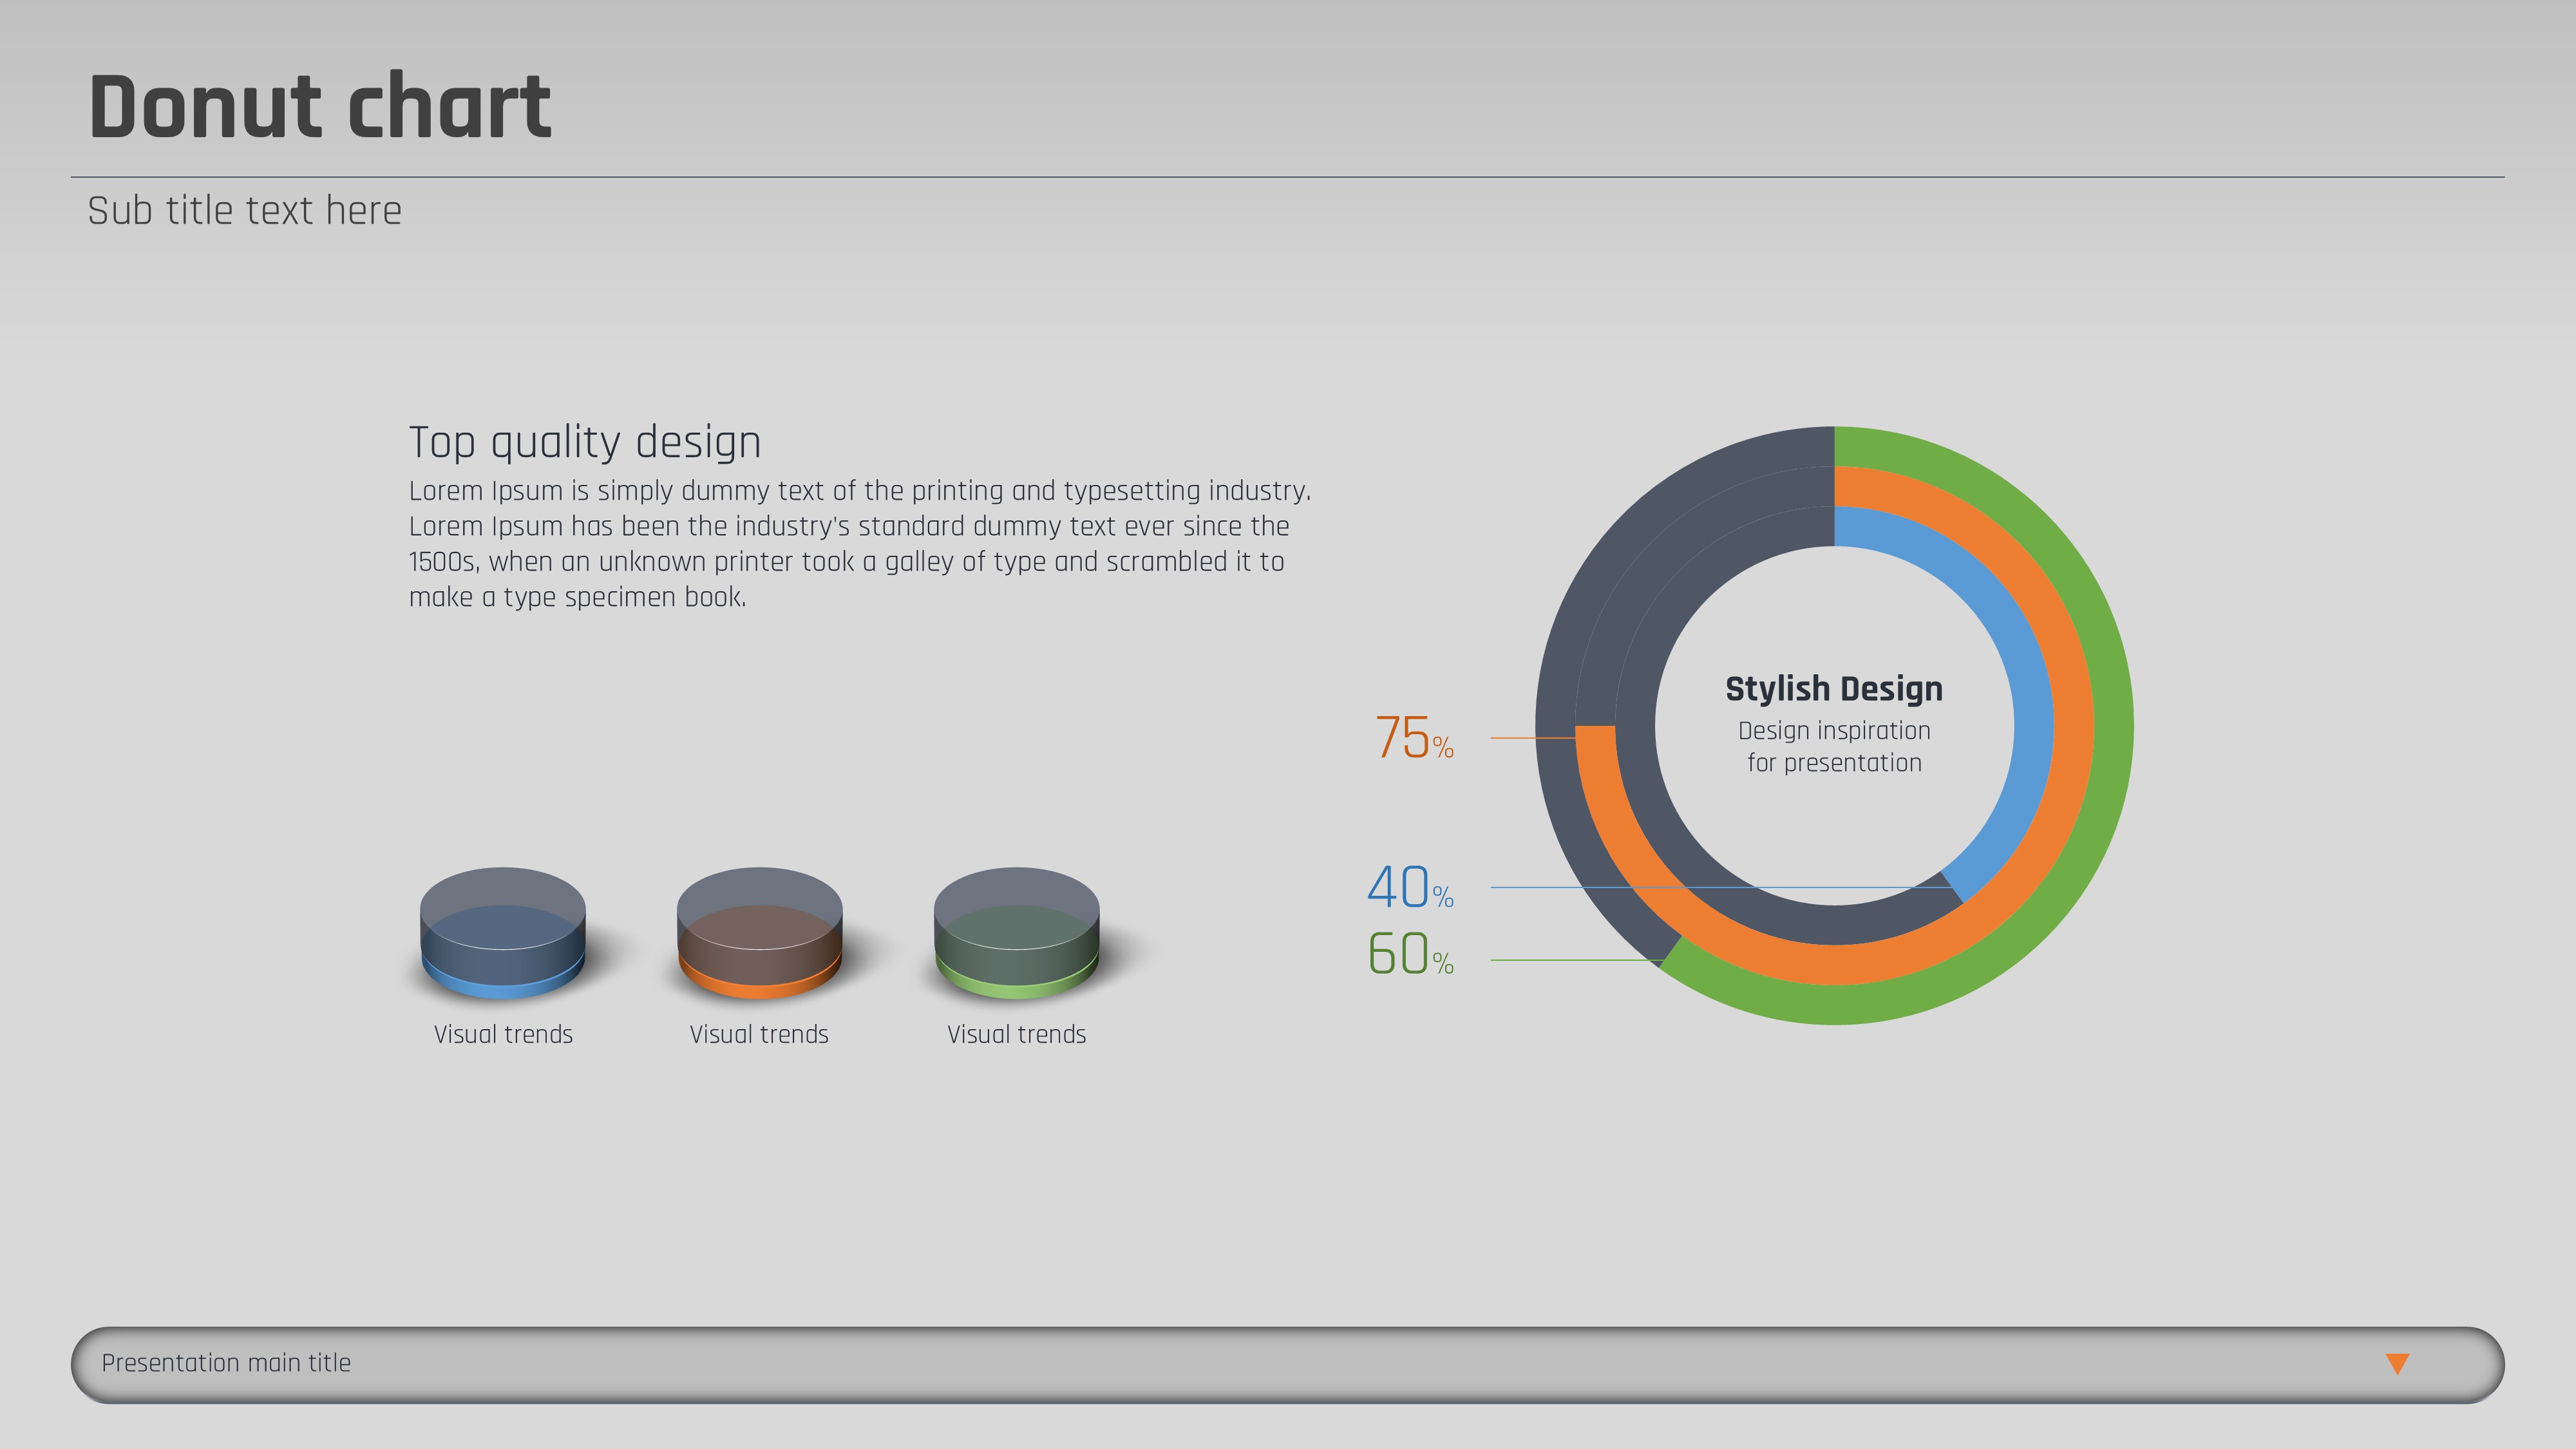
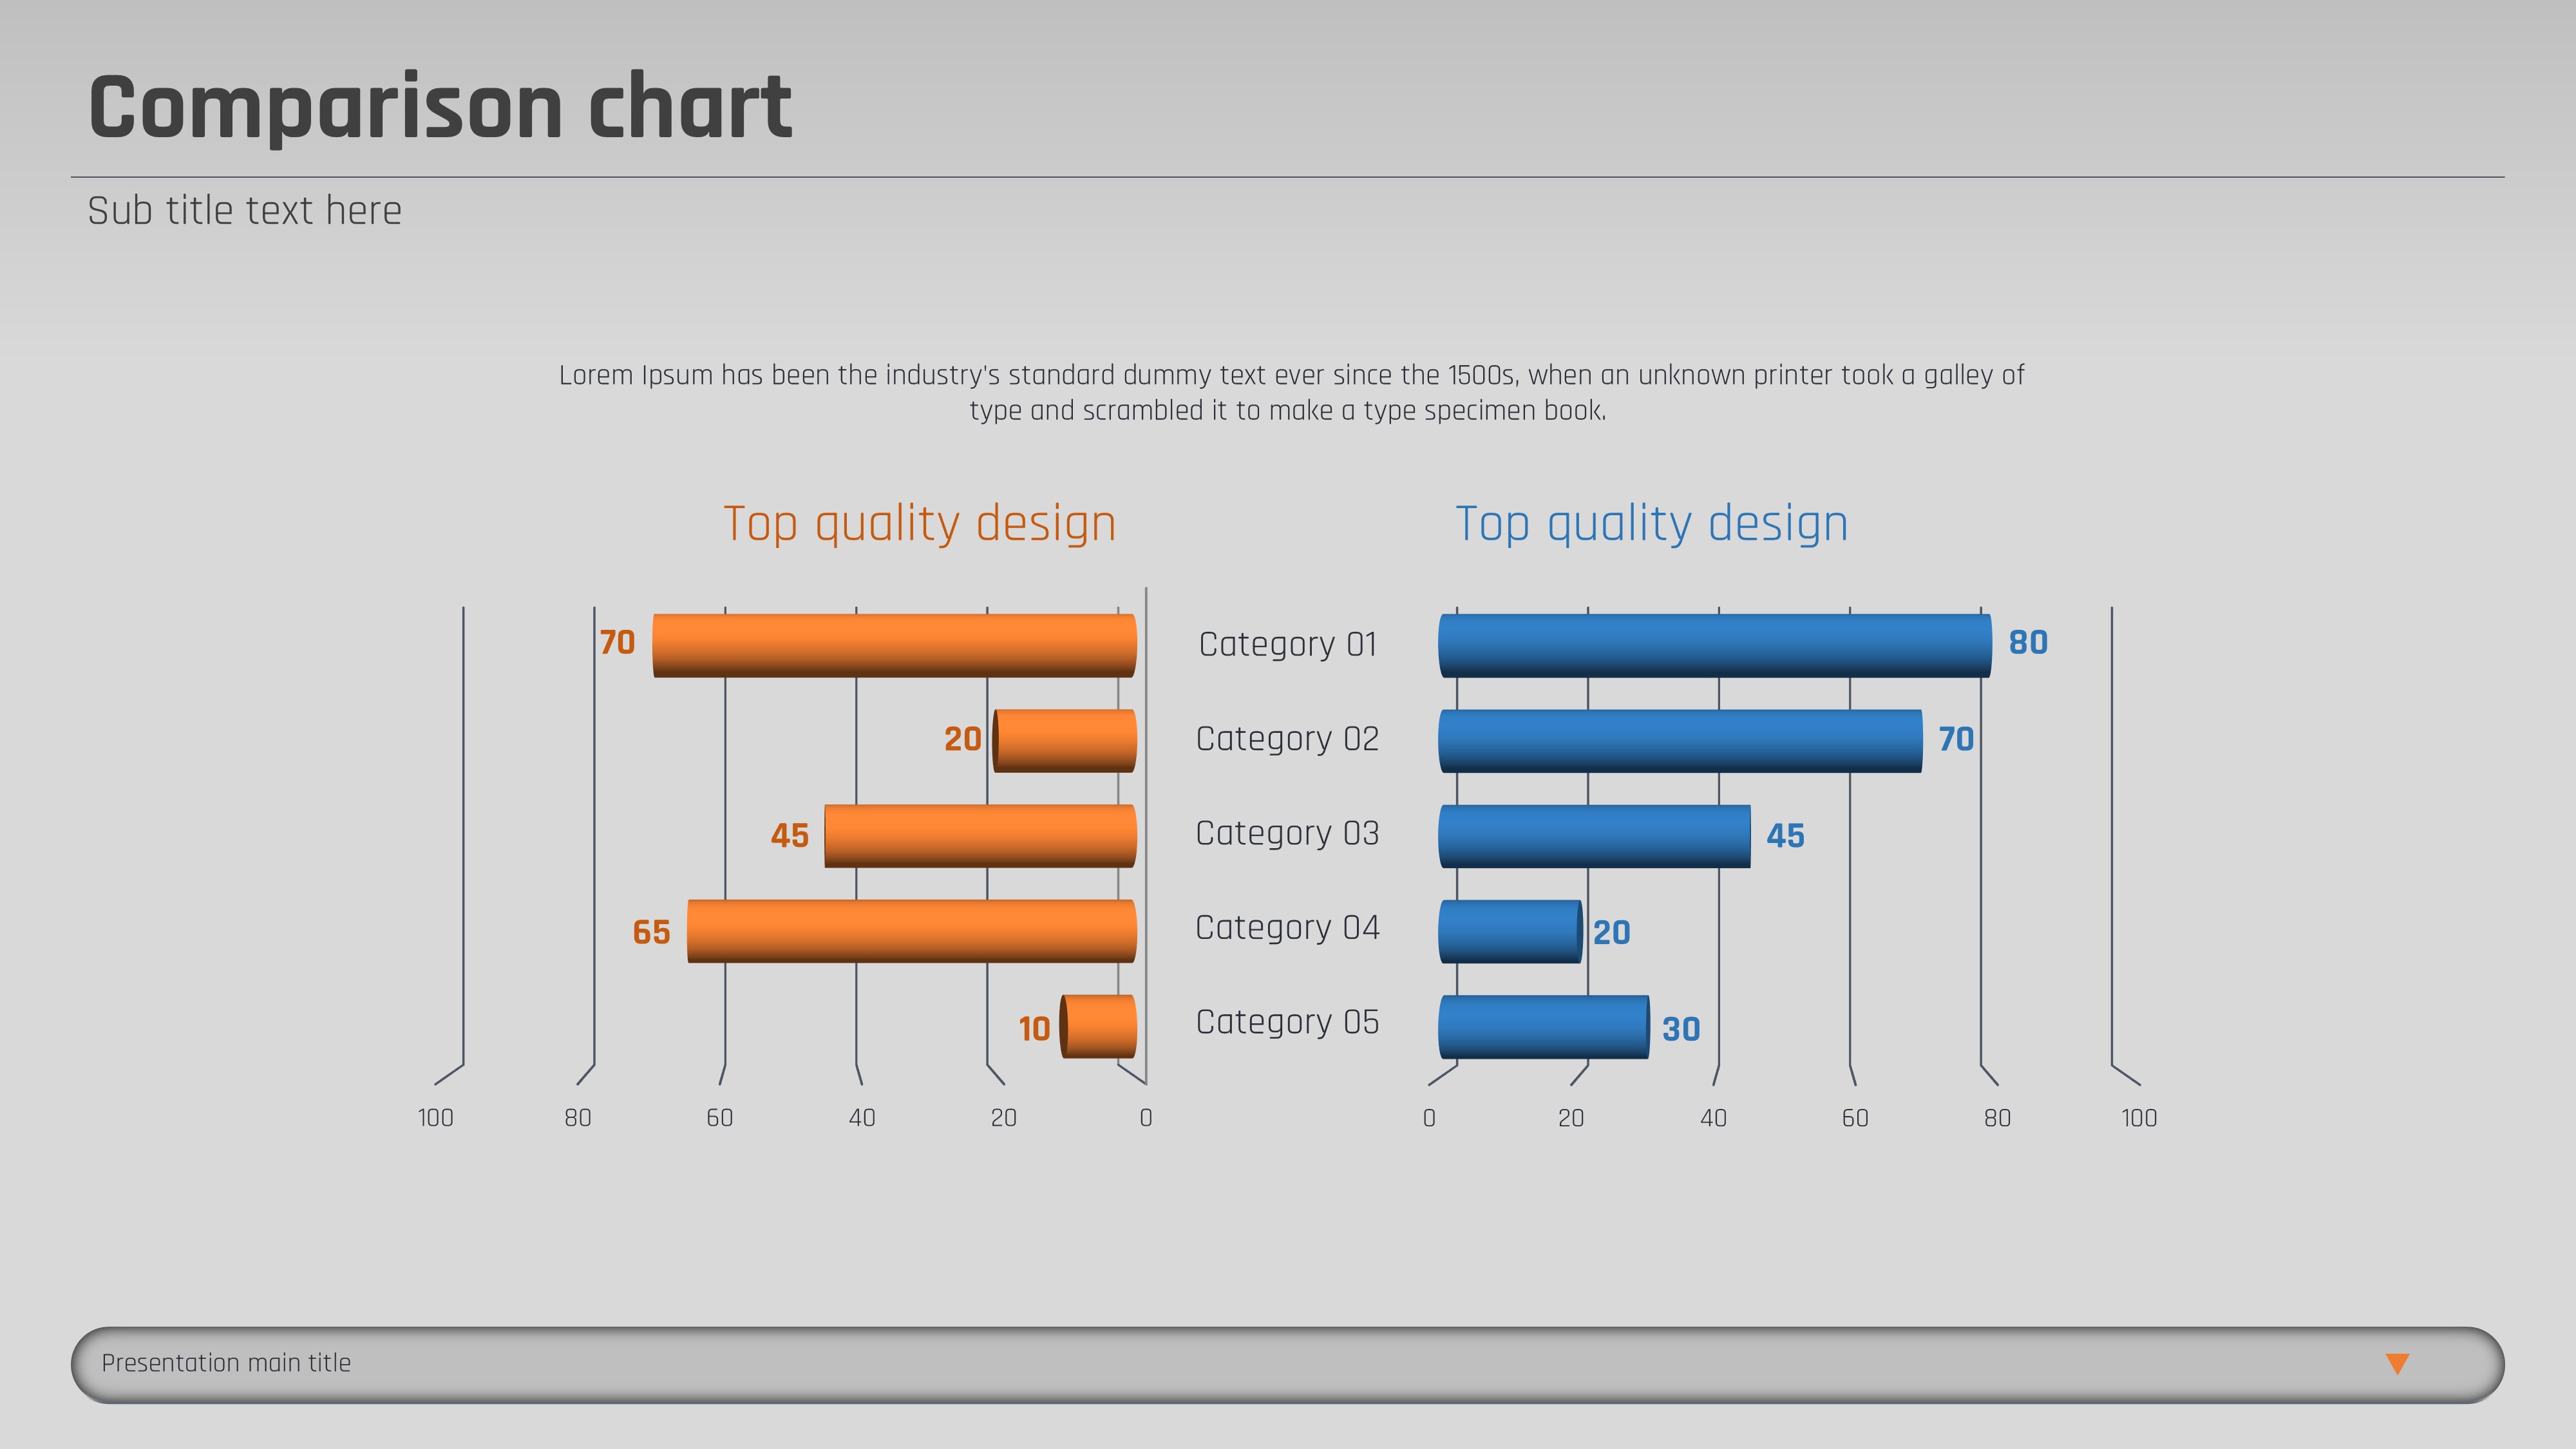
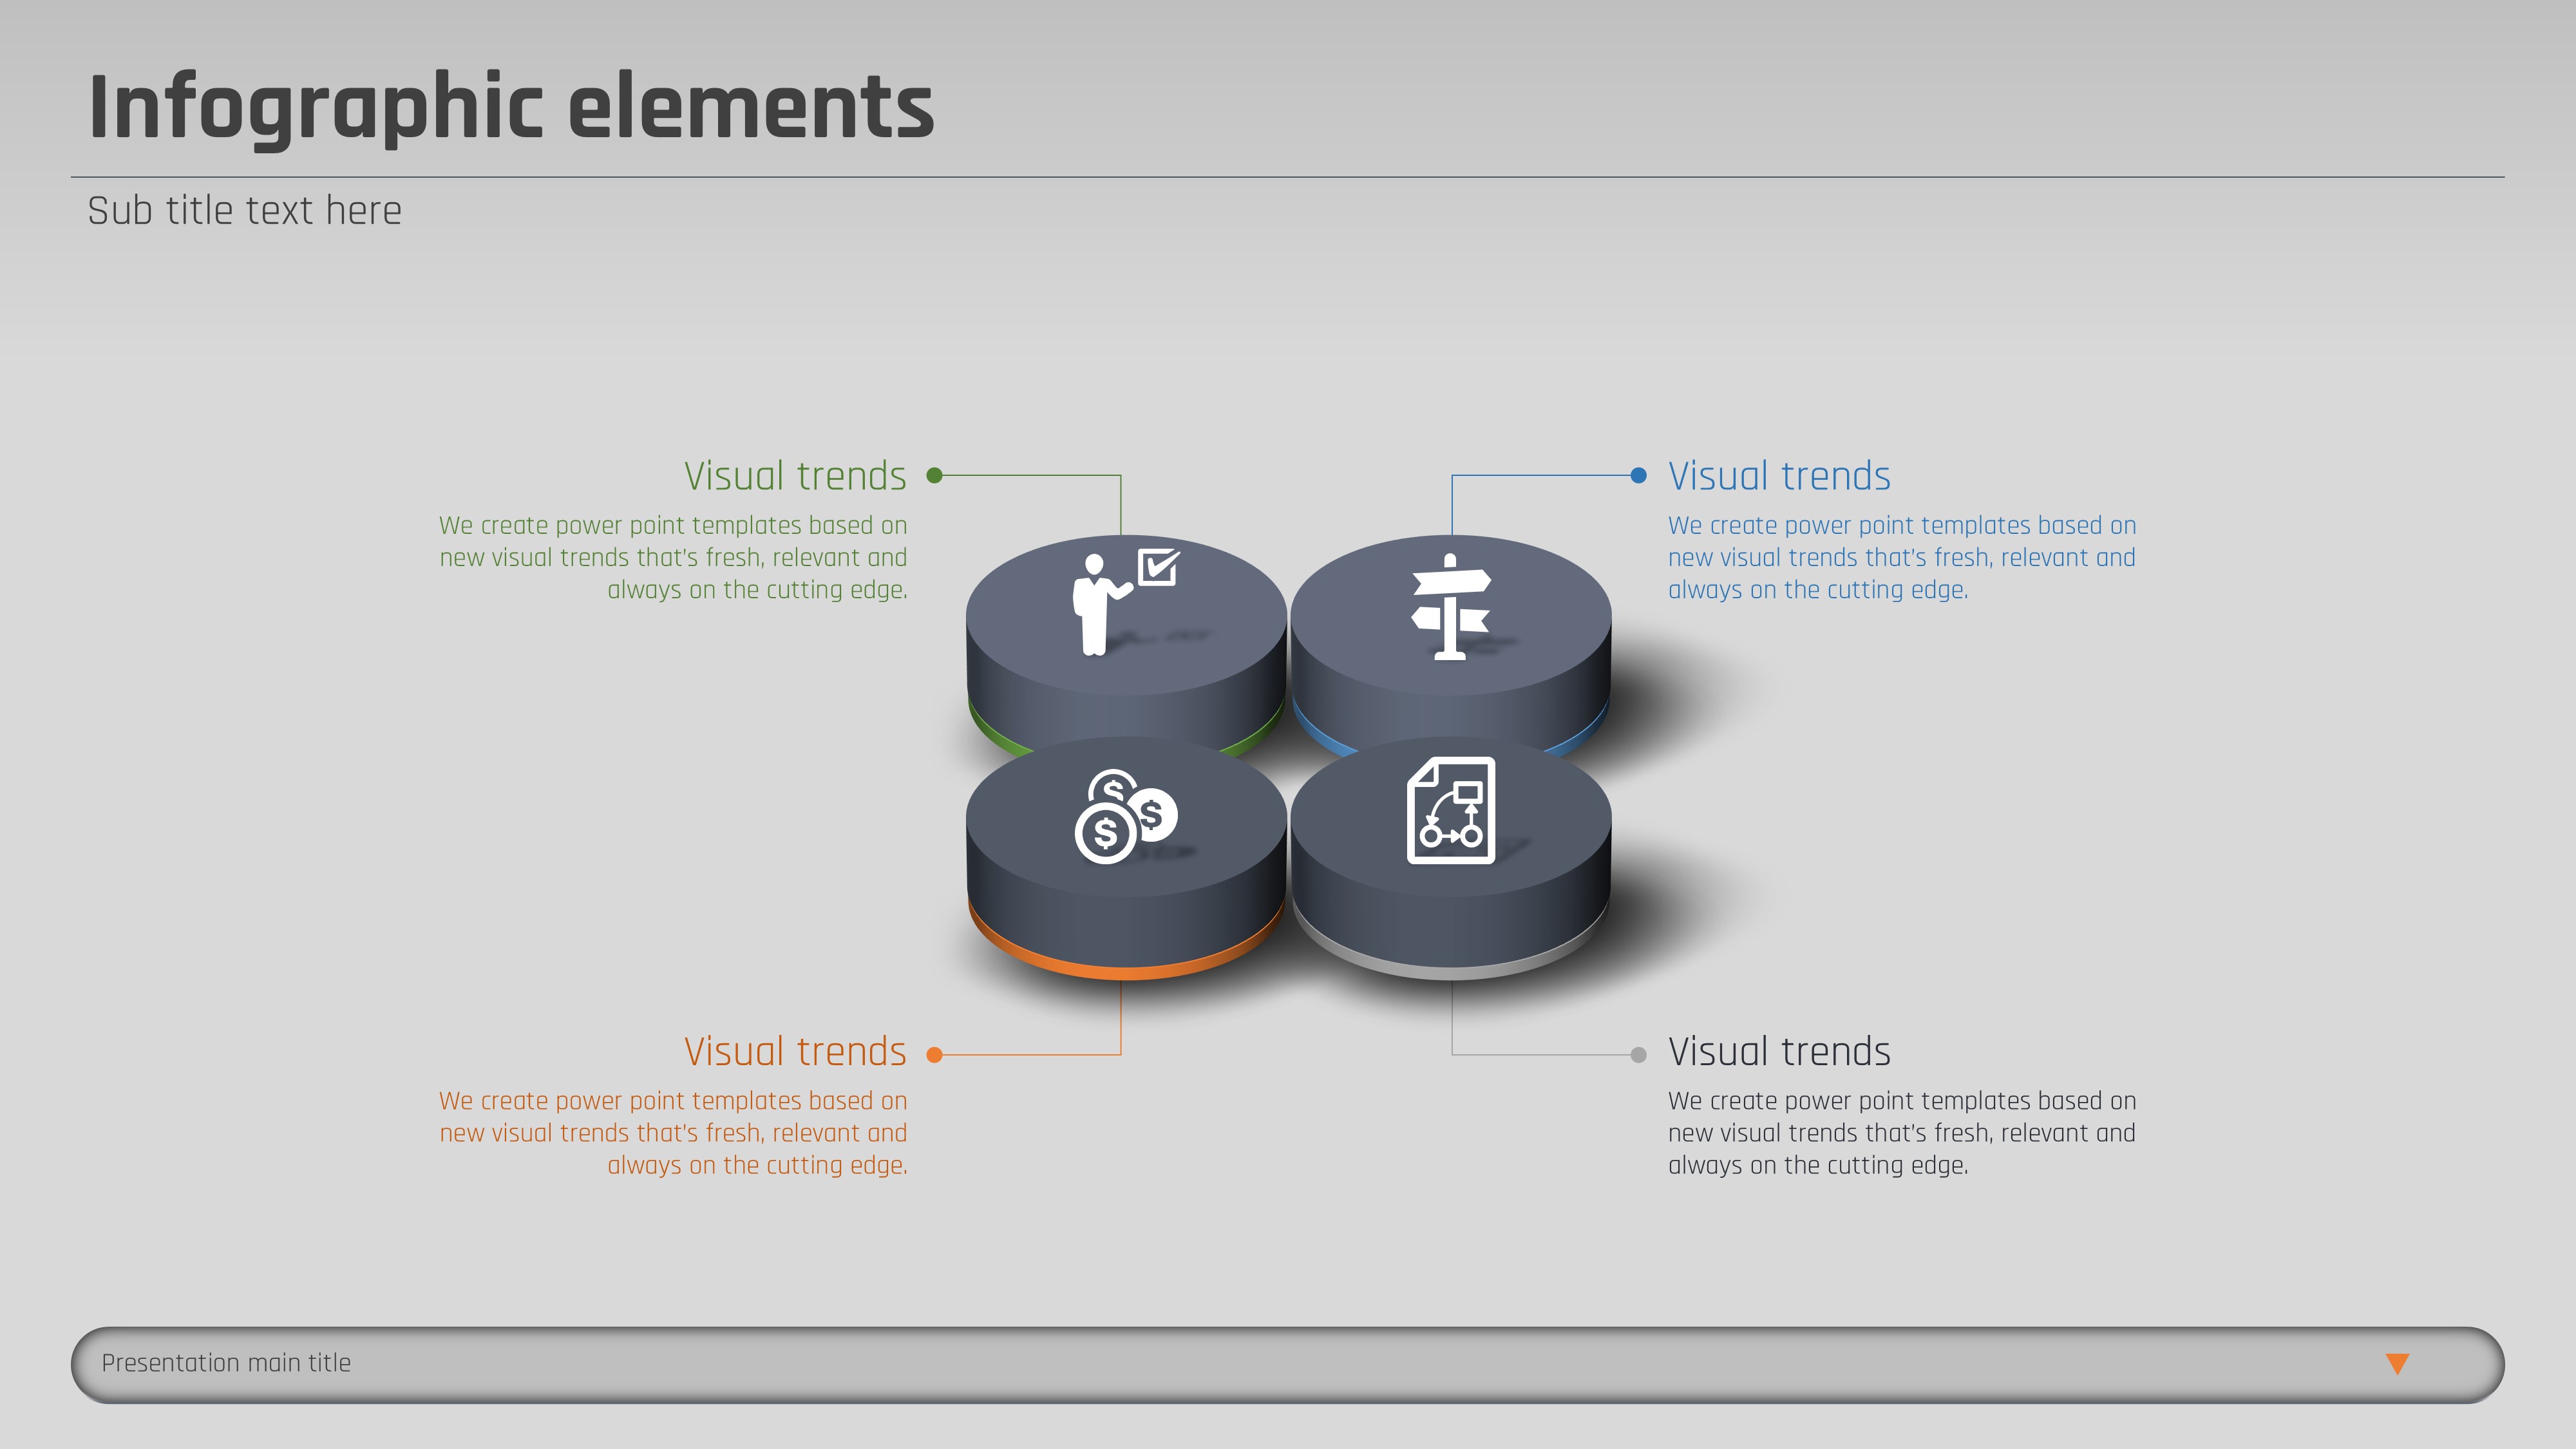
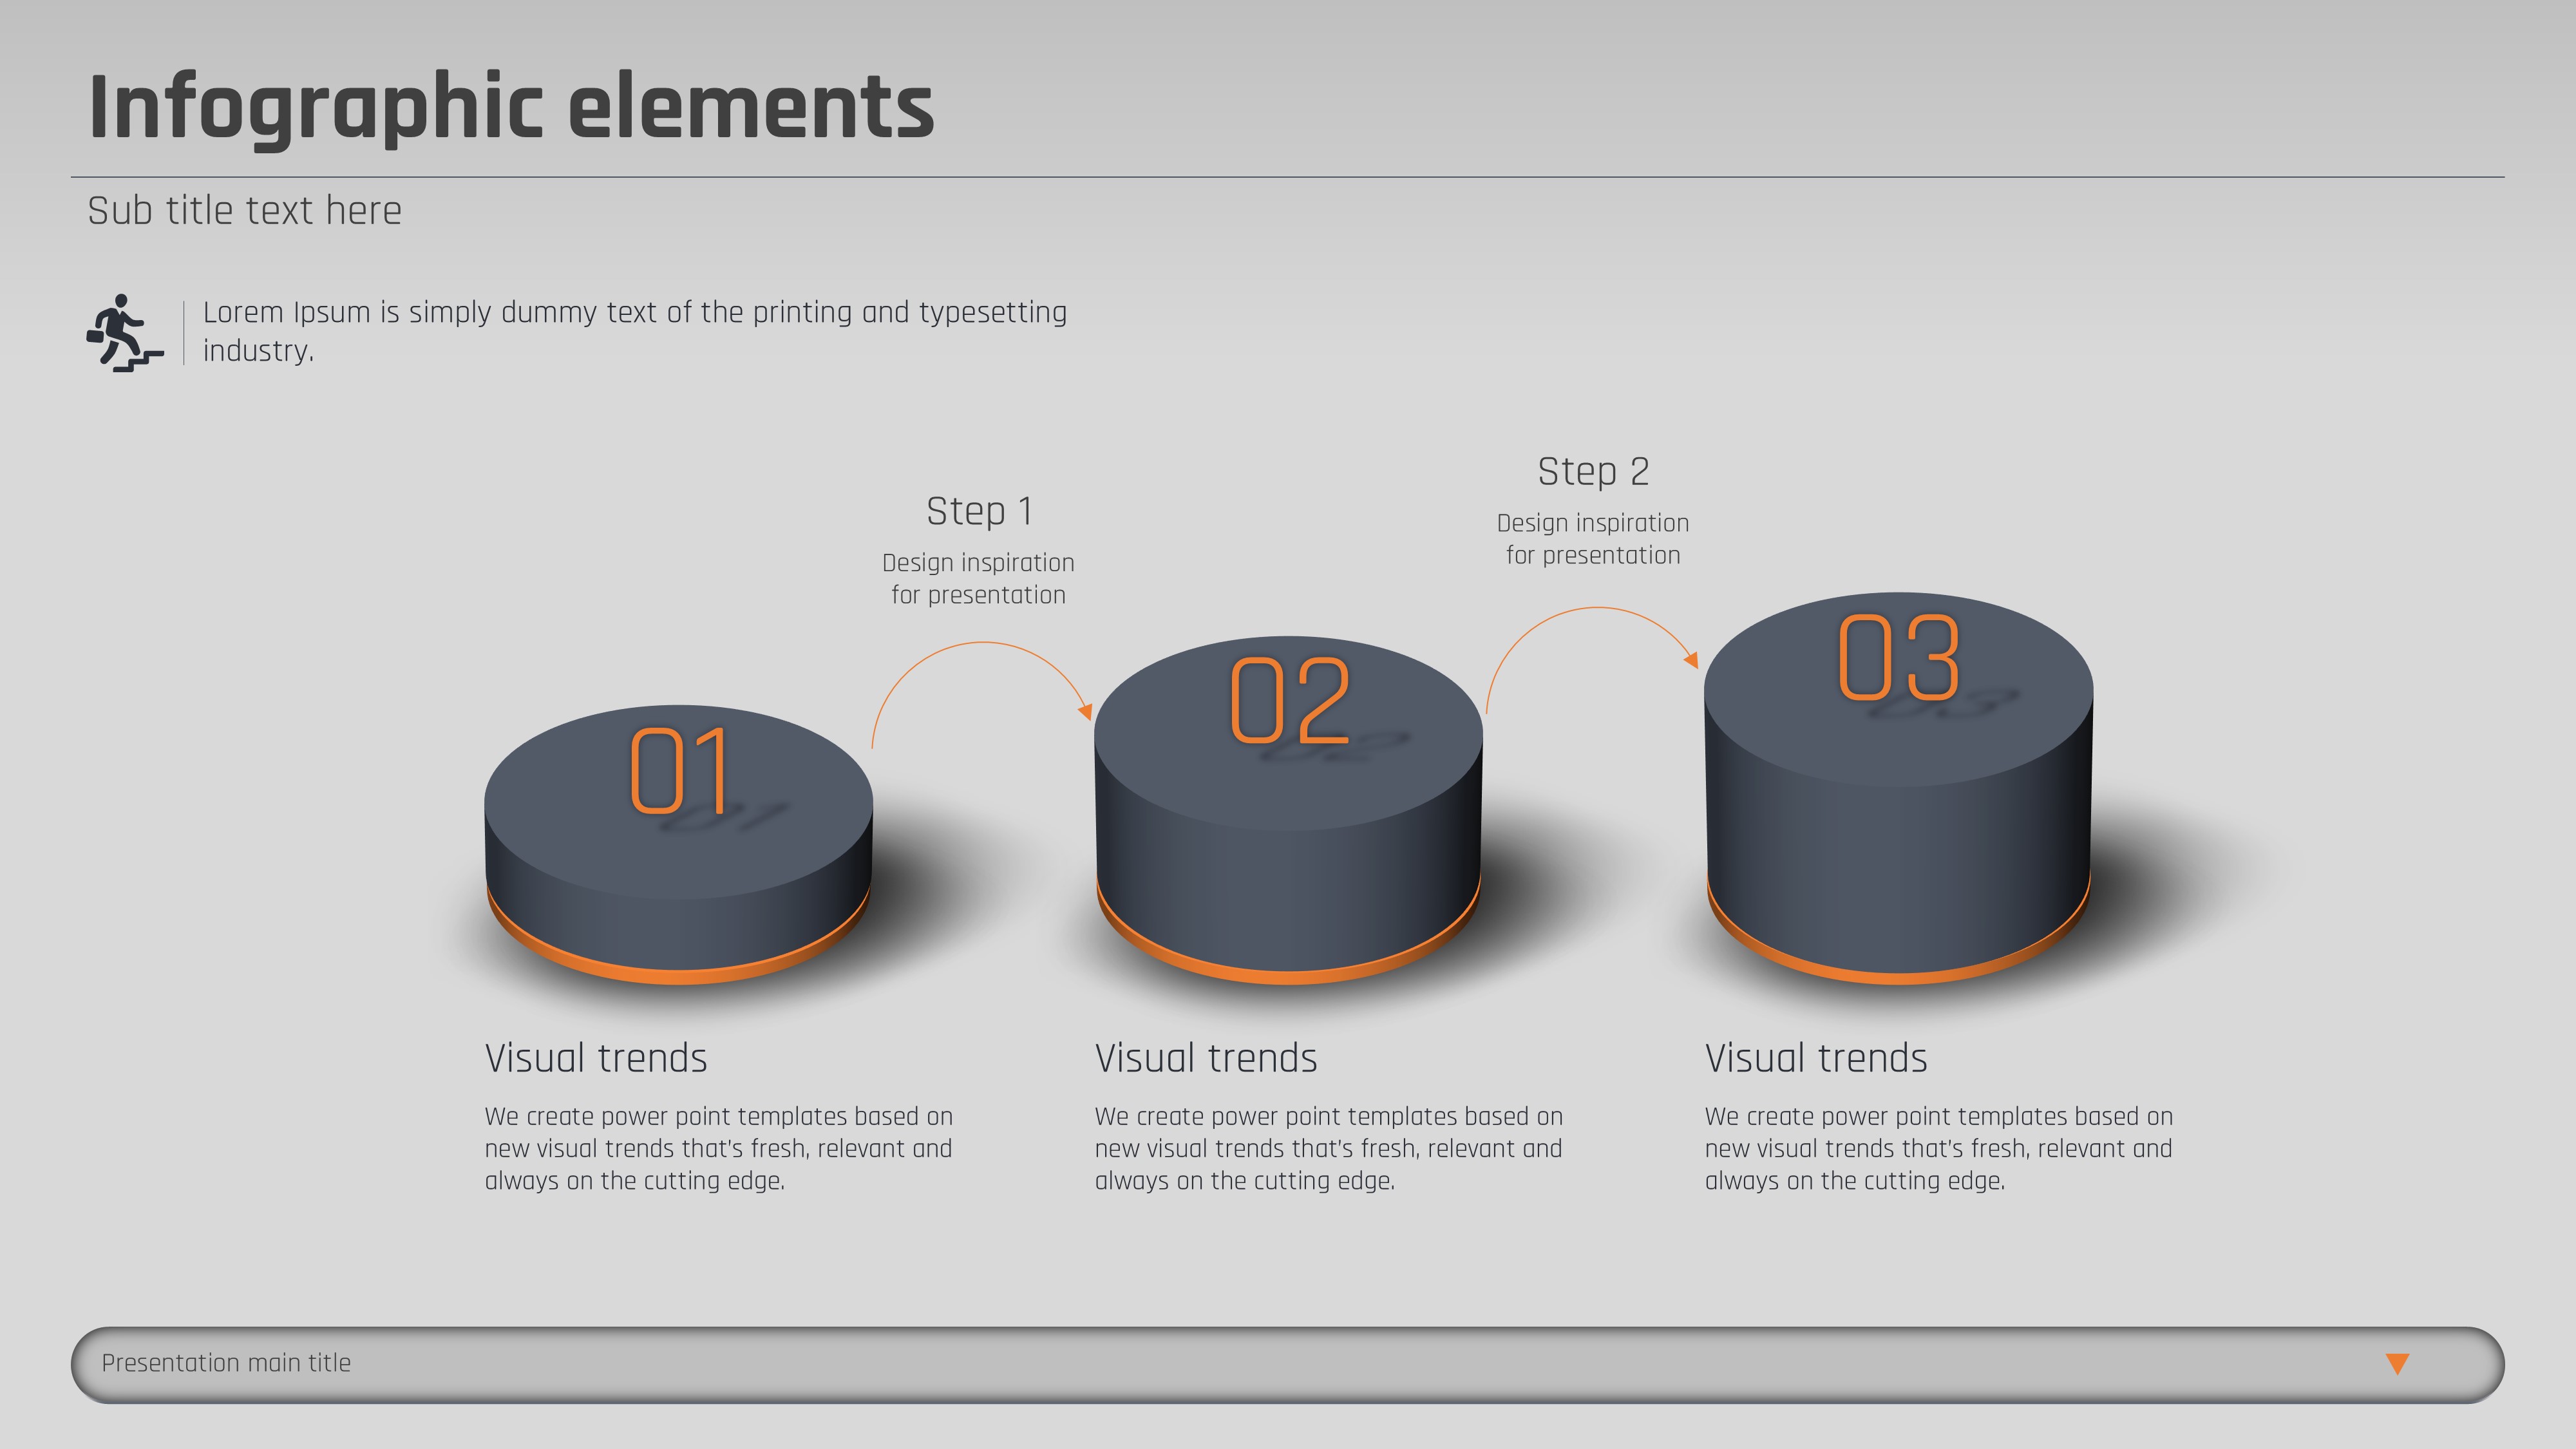
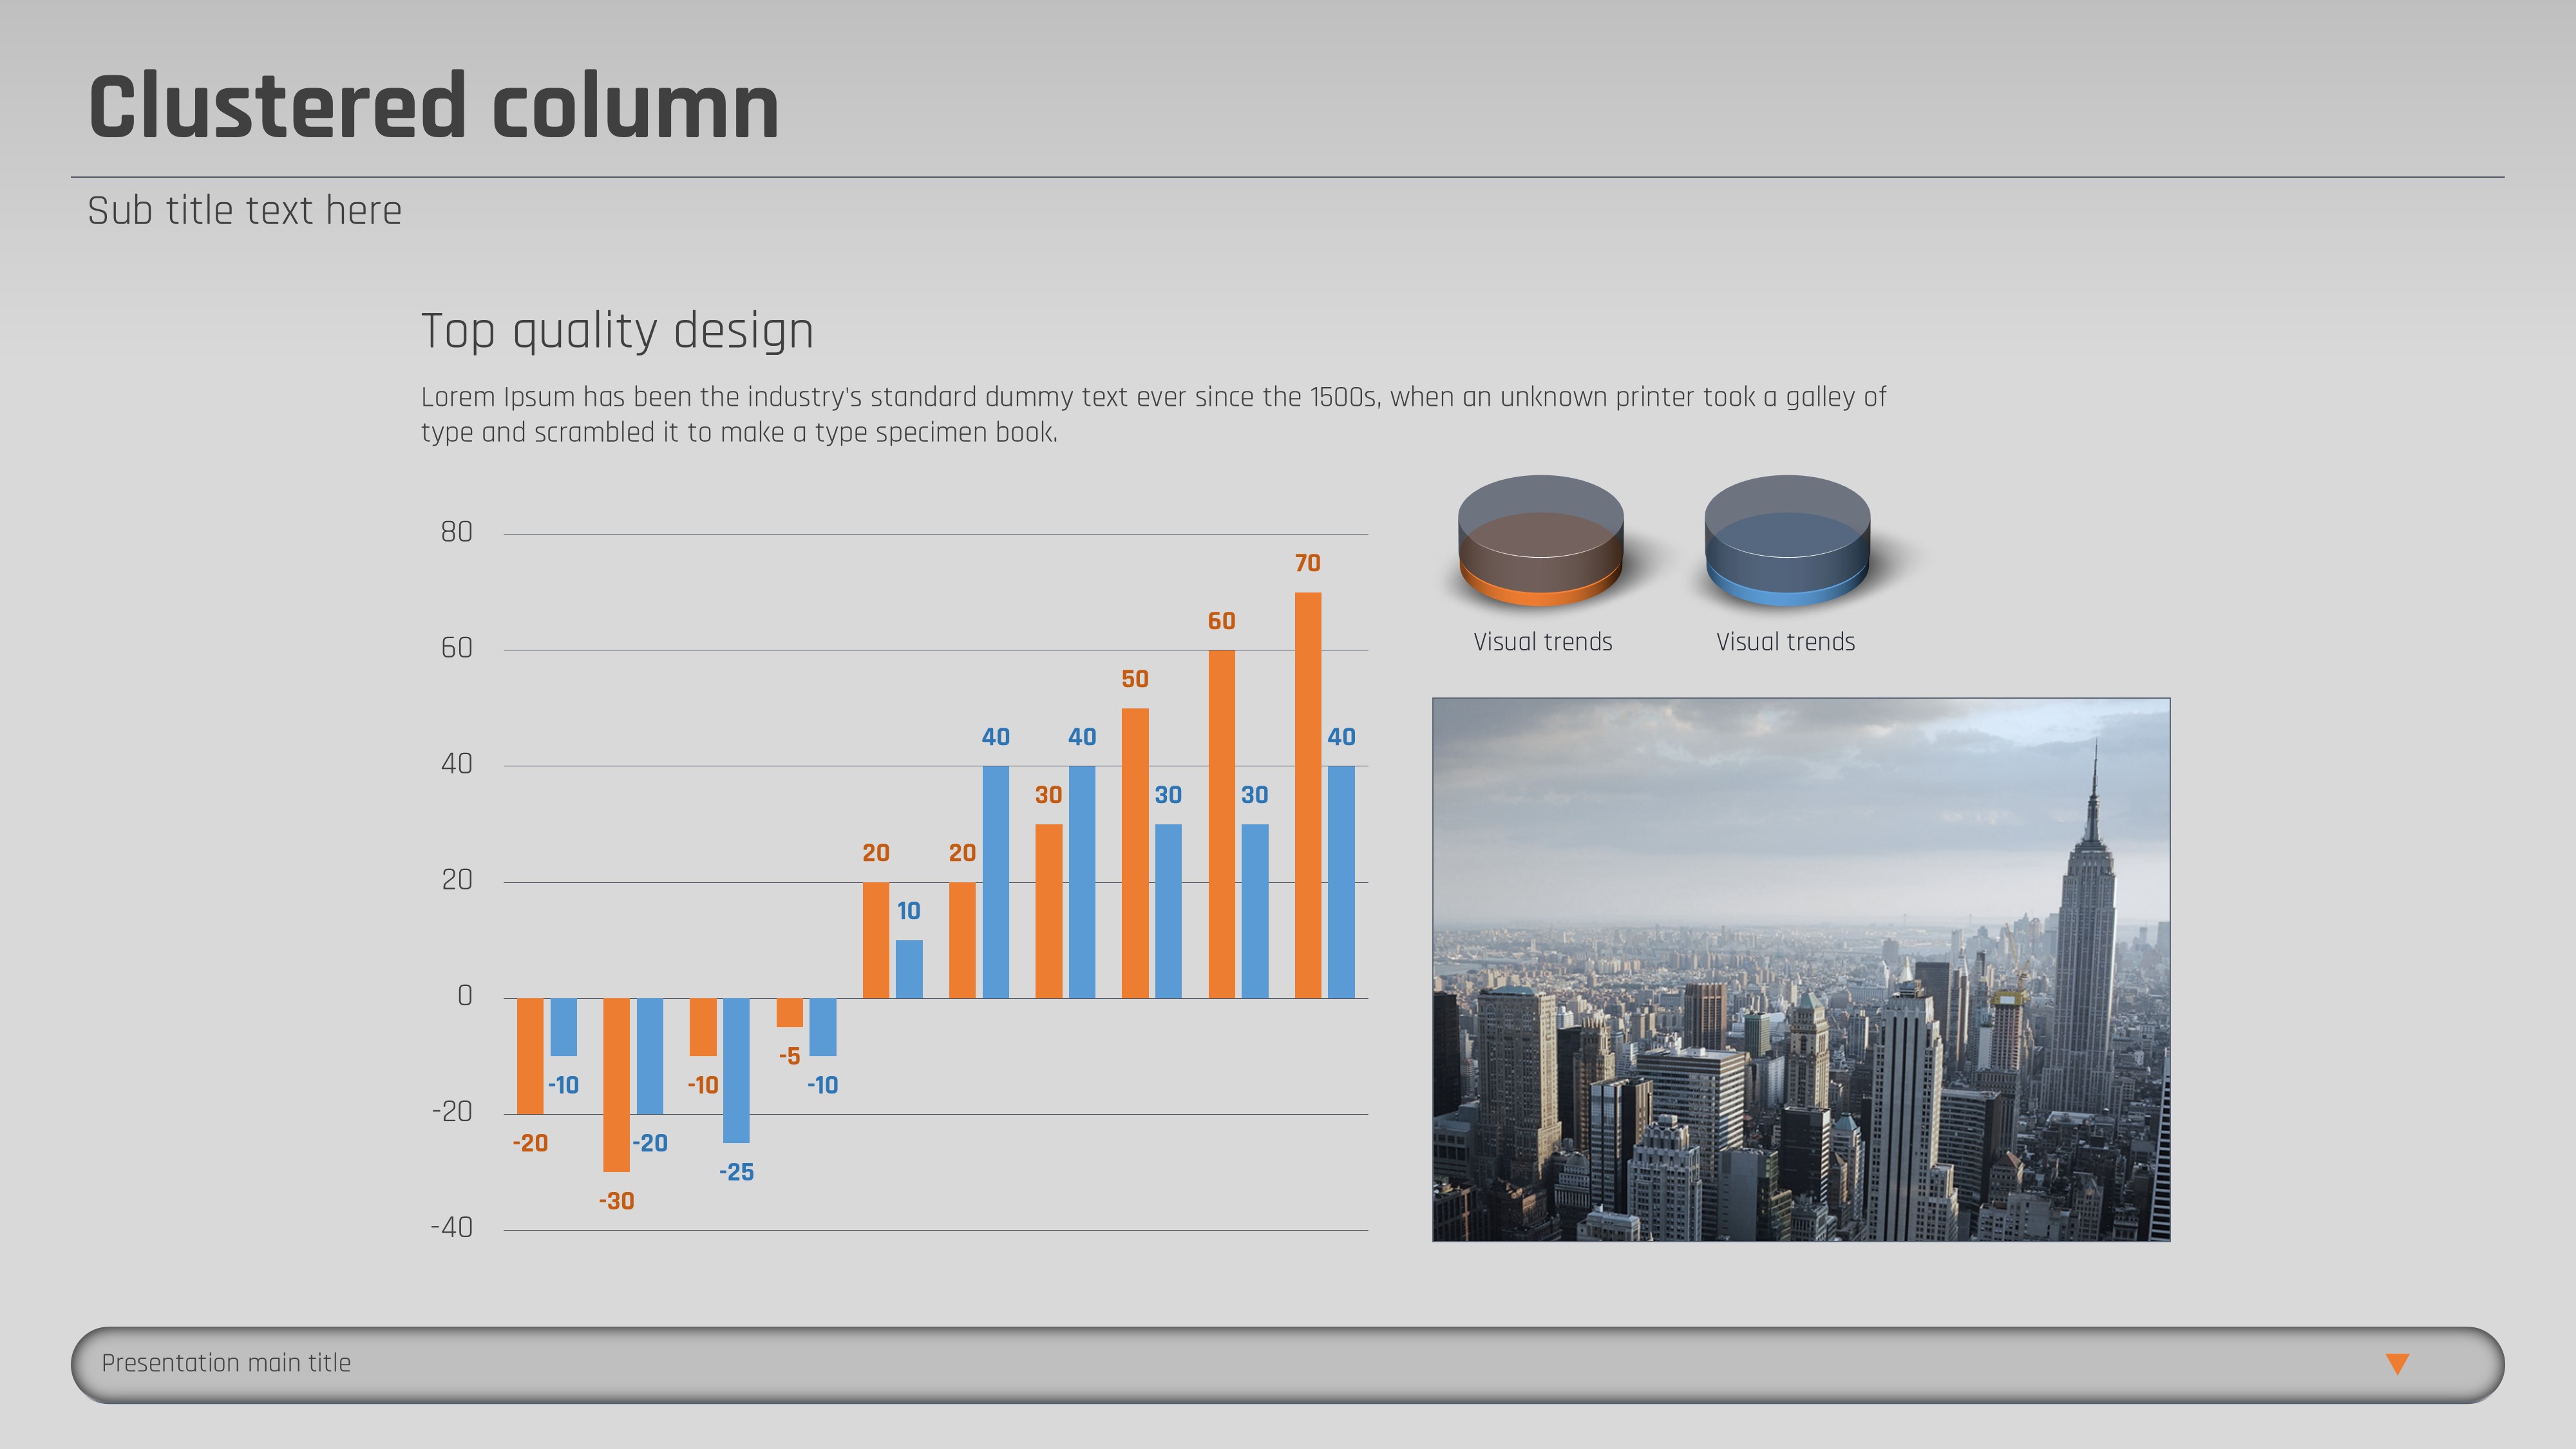
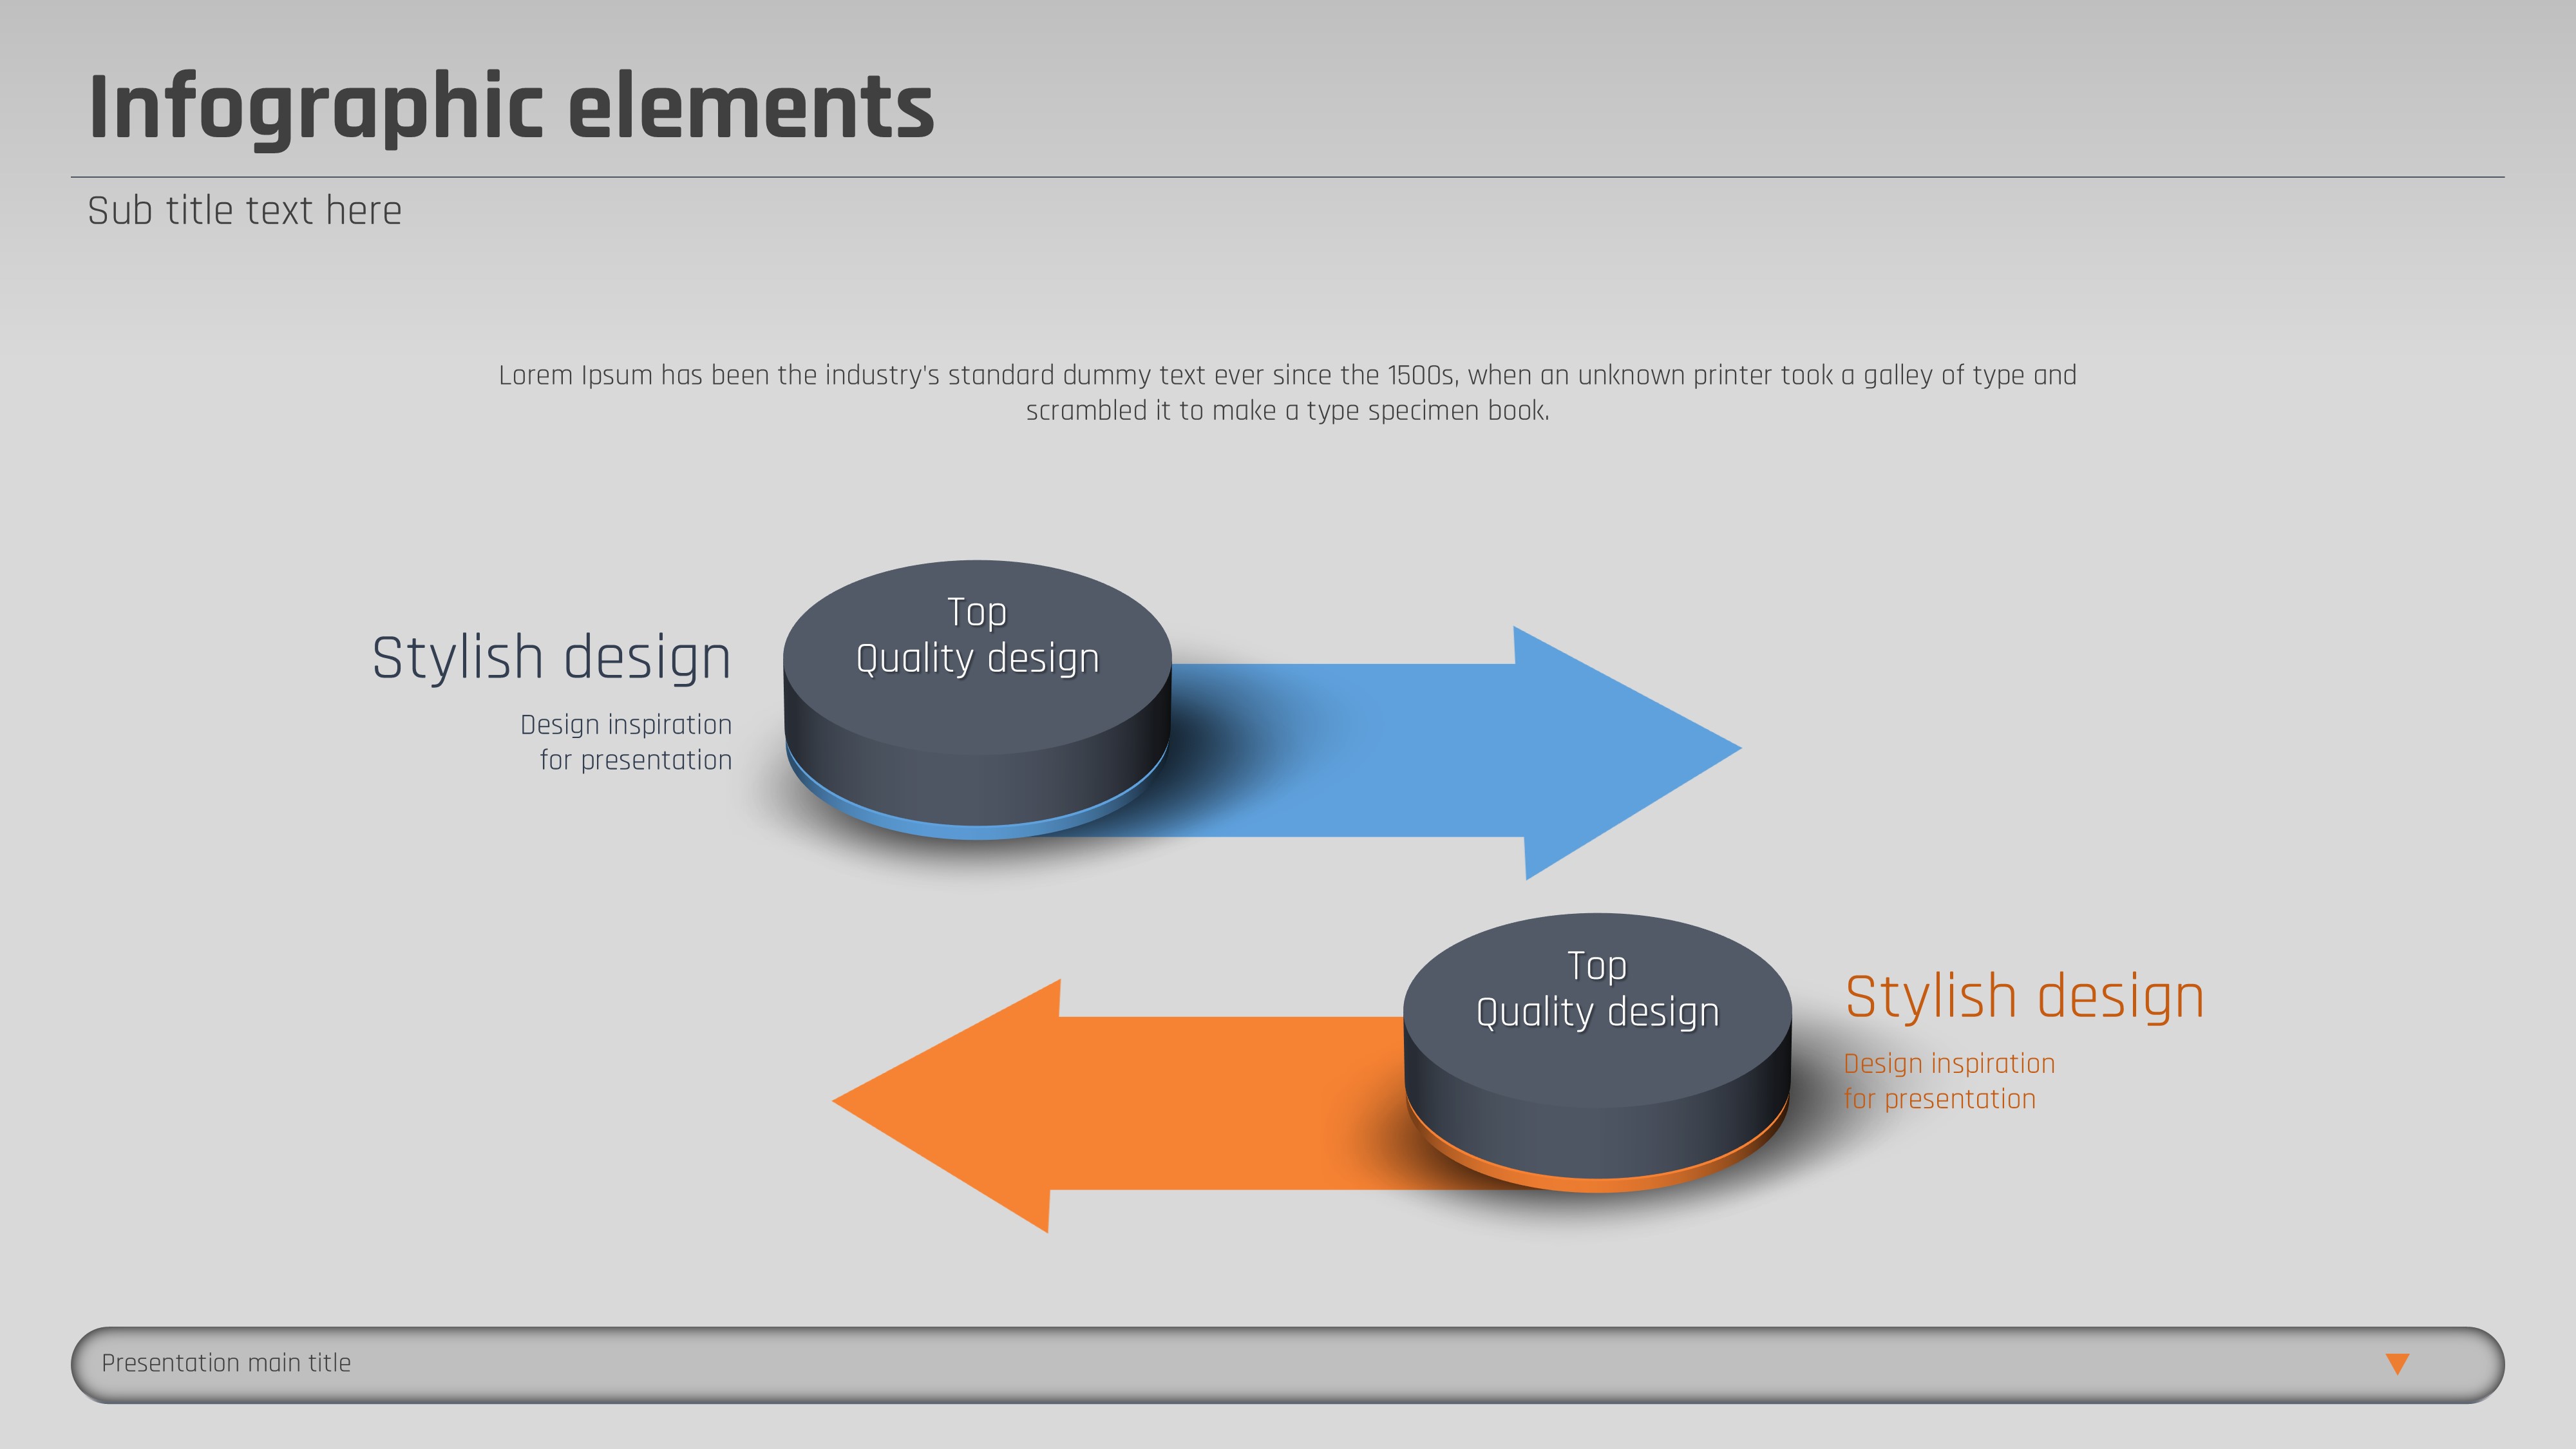
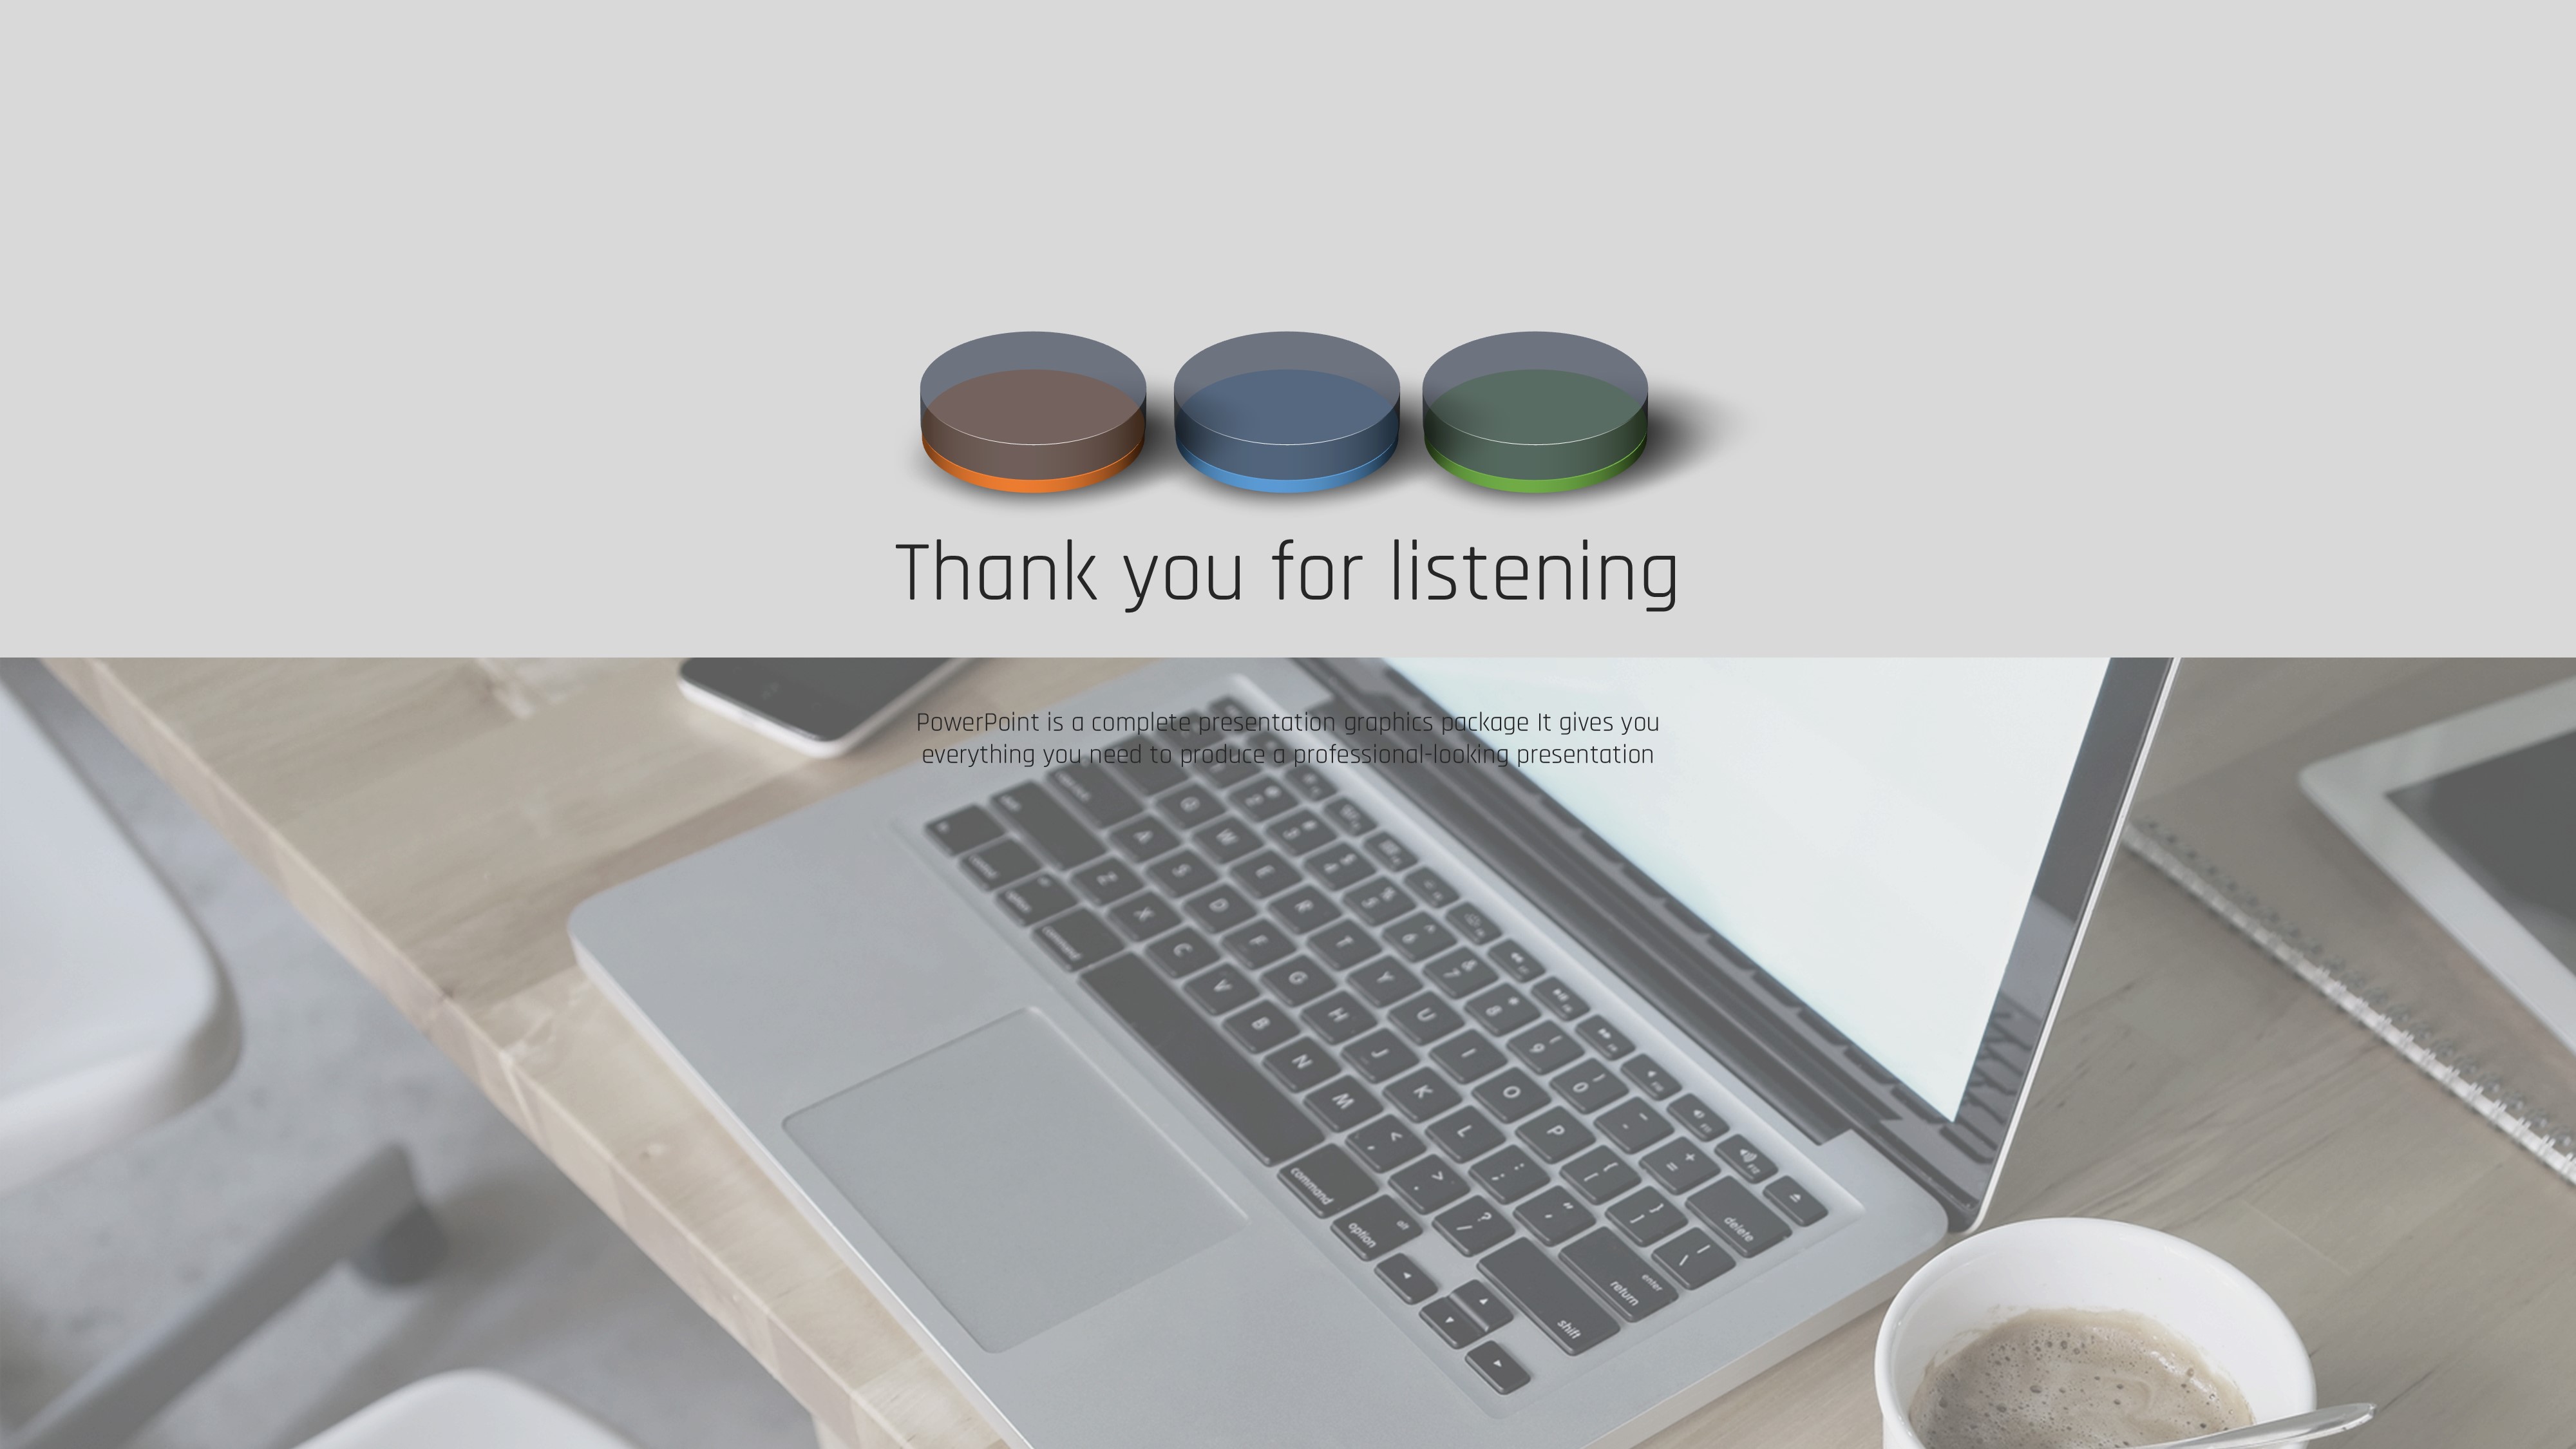
35 slides total: photo-background cover with title and slogan, 6-icon service grid, hexagonal step-by-step process diagram, 3D clustered column chart with directional arrows, 3-tier layered stack infographic with callout lines, and ribbon-style circular diagram layouts.
Related Products
-

Application PowerPoint Wide Template – Sleek Design and Practicality
#IT/Computer
-

SEO PowerPoint Wide Template – Modern and Visual-Centric Design
#IT/Computer
-

Car Safety PowerPoint Template – Innovative IT Slide Design
#IT/Computer
-

IOT Themed Portrait Presentation Template – Modern Design with Rich Visual Appeal
#IT/Computer
