Business Area Connection 3D Diagram – Emphasizing Technical Integration
RJ0400026_29
- Last Update 05/24/2025
- File Size 0.2MB
- # of Slides 2
- File Format PPTX
- Slide Ratio 16:9
- Color
Keywords
- #Content-Based Slides
- #Design-Based Slides
- #Business Introduction
- #Technical Approach
- #Diagram
- #Business Areas
- #System Architecture Diagram
- #Cluster
- #Chain Diagram
- #16:9
- #3D diagram PowerPoint
- #node connection slide
- #business area diagram
- #cluster diagram template
- #technical integration PPT
- #radial diagram slide
About the Product
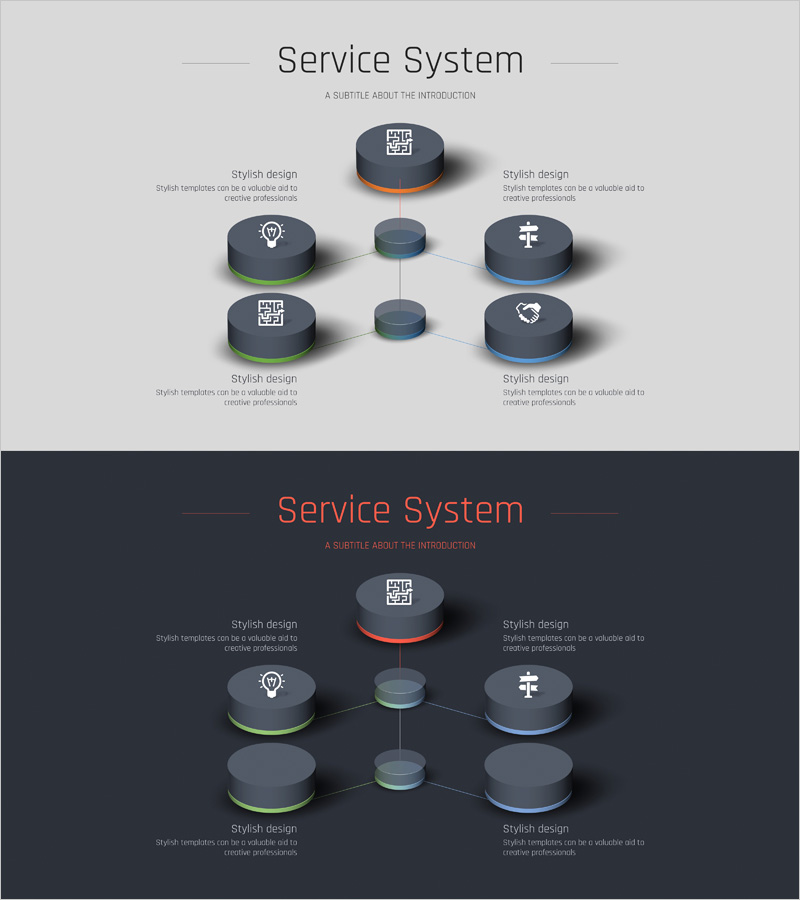
A 3D diagram PowerPoint slide that visualizes technical integration and interconnection between business areas. The structure radiates from a central hub to six surrounding nodes, representing independent yet organically connected system components. Dark gray cylindrical button-shaped nodes feature icons, with color-coded borders (green, blue, orange, purple) distinguishing each area. Two-slide composition provides both light and dark background versions for flexible presentation contexts. Delivered in 16:9 widescreen PPTX format, fully editable and ready to customize with your content.
Usage Points
-
Main Usage
Demonstrates how multiple business divisions or technical domains connect and integrate through a central hub. Icon-coded nodes represent departmental functions, while color-coded borders distinguish areas, making complex systems intuitive and visually clear.
-
How to Use
Apply in company profile presentations, business portfolio sections, or technology strategy discussions to explain interdepartmental connectivity. Edit node text and icons to reflect actual department or technology names. Adjust node count as needed for your organizational structure.
-
Recommended For
Ideal for executives, strategy managers, and technology leaders explaining organizational integration, digital transformation, or multi-division collaboration frameworks. Suitable for investor pitches, business briefings, strategic planning meetings, and cross-functional team presentations.
-
Slide Structure
Central hub with six surrounding nodes in radial configuration. Each node rendered as 3D cylindrical button with embedded icon. Connection lines between nodes express integration relationships. Dual-version design: light background (top) and dark background (bottom) for presentation flexibility.
Related Products
-

Business System Cycle Diagram – Emphasizing Business Flow
#Business Introduction #Technical Approach #Diagram
-

Puzzle Connection Diagram - Visual Approach and Cluster Map
#Company Introduction #Business Introduction #Diagram
-

Management Strategy Across Six Key Areas – Social Responsibility and Business Domains
#Business Introduction #Corporate Social Responsibility #Diagram
-

Mobile Global Service Core Competency Slide
#Business Introduction #Business Vision and Strategy #Diagram
