Competitive Advantage 3D Bi-directional Bar Graph – Essential Tool for Market Analysis
RJ0400026_30
- Last Update 05/24/2025
- File Size 0.2MB
- # of Slides 2
- File Format PPTX
- Slide Ratio 16:9
- Color
Keywords
- #Content-Based Slides
- #Design-Based Slides
- #Market and Competitor Analysis
- #Graph
- #Competitor Analysis
- #Competitive Advantage
- #Horizontal Bar
- #Double Horizontal Bar
- #16:9
- #bi-directional bar chart PowerPoint
- #horizontal bar graph template
- #comparison analysis slide
- #competitive analysis chart
- #market research PowerPoint
About the Product
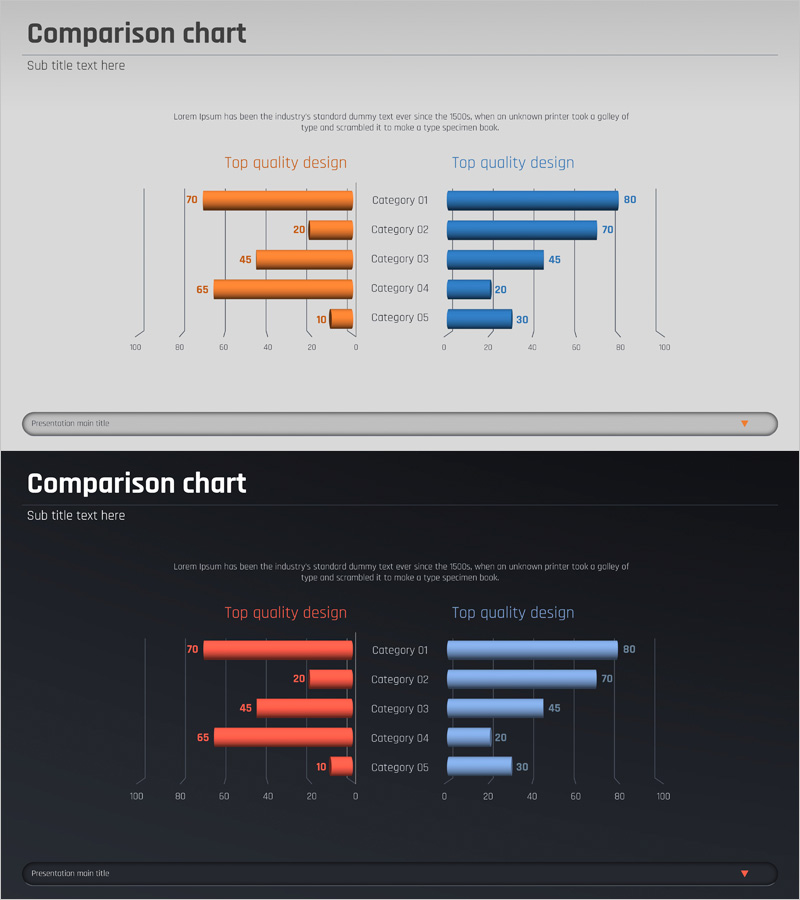
A horizontally-oriented bar chart PowerPoint slide with symmetrical left-right layout for comparative analysis. The design uses contrasting orange and blue color schemes to distinguish between two data groups, making it ideal for competitive analysis, market research, and performance comparisons. Each data point is clearly labeled with numerical values for precise quantitative representation. The template includes 2 slides optimized for 16:9 widescreen format in PPTX.
Usage Points
-
Main Usage
Enables side-by-side comparison of two data groups using symmetrical horizontal bars. Ideal for competitive positioning, pros-and-cons analysis, market share comparison, and customer satisfaction benchmarking. The clear numerical labels emphasize quantitative comparison and data-driven insights.
-
How to Use
Left orange bars represent your company or first category; right blue bars represent competitors or second category. Simply click on the bar values and category labels to edit with your actual data. The chart automatically adjusts proportions as you update the numbers.
-
Recommended For
Marketing managers, business strategists, executives preparing reports, market research analysts, management consultants, and investment pitch presenters. Suitable for business plans, quarterly performance reports, competitive analysis documents, and proposal presentations.
-
Slide Structure
2-slide template featuring symmetrical horizontal bar charts with 5 data categories per slide. Left side displays 5 items (70, 20, 45, 65, 10) in orange; right side shows 5 items (80, 70, 45, 20, 30) in blue. Numerical labels appear above each bar. Both light and dark background versions included for presentation flexibility.
Related Products
-

Competitor Paired Bar Graph – Market Analysis and Comparison
#Market and Competitor Analysis #Graph #Competitor Analysis
-

Horizontal Bar Graph for Cooking Competition
#Market and Competitor Analysis #Graph #Competitor Analysis
-

Bar Graph Comparing Exercise Performance by Group
#Market and Competitor Analysis #Graph #Competitor Analysis
-

Competitor Analysis Bar Graph – Check Market Advantage
#Market and Competitor Analysis #Graph #Competitor Analysis
