Airplane Analysis 3D Vertical Bar Graph – Understanding Market Trends
RJ0400026_27
- Last Update 05/24/2025
- File Size 1.6MB
- # of Slides 2
- File Format PPTX
- Slide Ratio 16:9
- Color
Keywords
- #Content-Based Slides
- #Design-Based Slides
- #Market and Competitor Analysis
- #Graph
- #Market Analysis
- #Column
- #Segmented Column
- #16:9
- #100% stacked bar chart PowerPoint
- #stacked column chart template
- #year-over-year comparison slide
- #aviation industry analysis presentation
- #market trend visualization template
About the Product
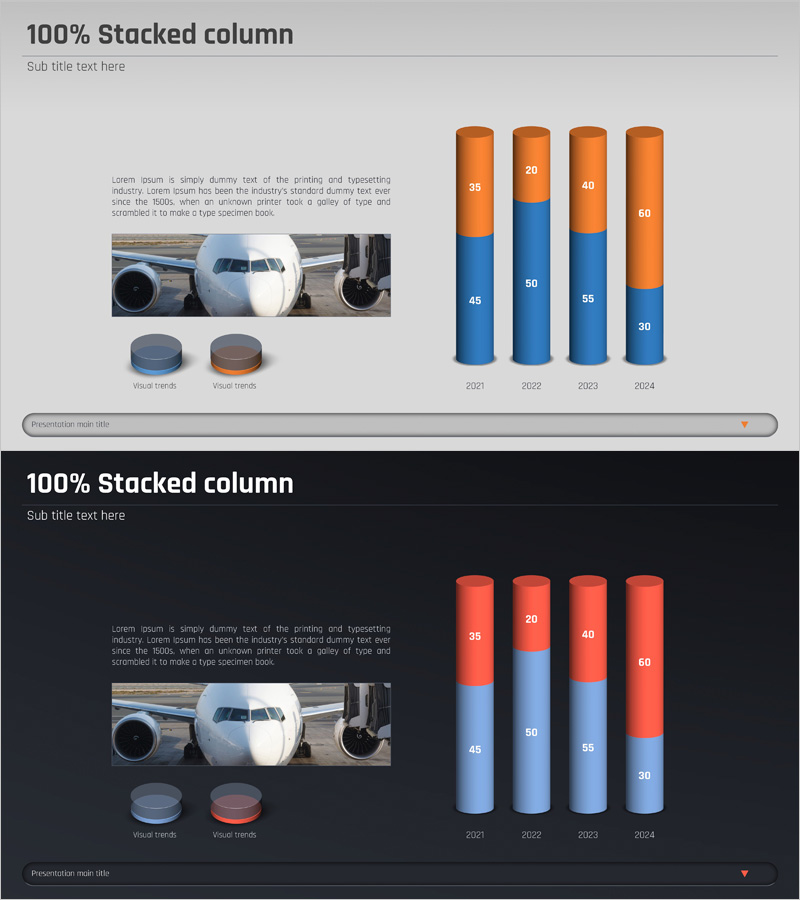
A 100% stacked vertical bar chart PowerPoint slide designed for aviation industry market trend analysis. This presentation template visualizes data from 2021 to 2024 across four consecutive years, using blue and orange color series to distinguish between two data categories. The slide set enables viewers to instantly compare compositional ratio changes year-over-year and understand relative proportions within the total market. Optimized for 16:9 widescreen format, this 2-slide deck is ready for airline performance reports, investment presentations, and industry analysis briefings. All data fields are fully editable for immediate customization.
Usage Points
-
Main Usage
Displays compositional ratio changes across years and categories in stacked format, allowing simultaneous comparison of both absolute scale and relative proportions. Ideal for visualizing market share evolution, revenue composition by segment, and customer demographic shifts in the aviation sector.
-
How to Use
Insert into executive reports, investor presentations, and industry analysis decks within the market trends section to support data-driven decision-making. The stacked bar height and color differentiation intuitively communicate how component proportions shift over time.
-
Recommended For
Executives and analysts at airlines, aerospace manufacturers, and logistics companies presenting to investors and stakeholders. Particularly effective when analyzing market share transitions, business unit revenue composition, and customer segment proportion changes.
-
Slide Structure
2-slide set featuring 100% stacked vertical bar charts spanning 2021–2024. Each chart uses blue (lower segment: 45–55) and orange (upper segment: 20–60) to represent two data series. Layout combines aircraft imagery and descriptive text on the left with the chart visualization on the right.
Related Products
-

Segmented Analysis of Interior Trends – Data Visualization for Market Analysis
#Market and Competitor Analysis #Financial Plans and Performance #Graph
-

Trade Business Analysis Graph – Visualizing Market Status
#Market and Competitor Analysis #Graph #Market Status
-

Market Analysis Segmented Bar Graph & Table Chart – Visualization of Competitive Analysis
#Market and Competitor Analysis #Diagram #Graph
-

Graph of Changes in Media Utilization
#Market and Competitor Analysis #Graph #Future Outlook
