Market Share Analysis 3D Pie Graph – Visualizing Market Trends
RJ0400026_19
- Last Update 05/24/2025
- File Size 0.3MB
- # of Slides 2
- File Format PPTX
- Slide Ratio 16:9
- Color
Keywords
- #Content-Based Slides
- #Design-Based Slides
- #Product/Service Introduction
- #Market and Competitor Analysis
- #Graph
- #Development Status
- #Market Share
- #Circles
- #Pie Chart
- #16:9
- #3D pie chart PowerPoint
- #pie chart slide template
- #market share analysis chart
- #data visualization PowerPoint
- #pie graph presentation slide
- #how to create pie chart in PowerPoint
About the Product
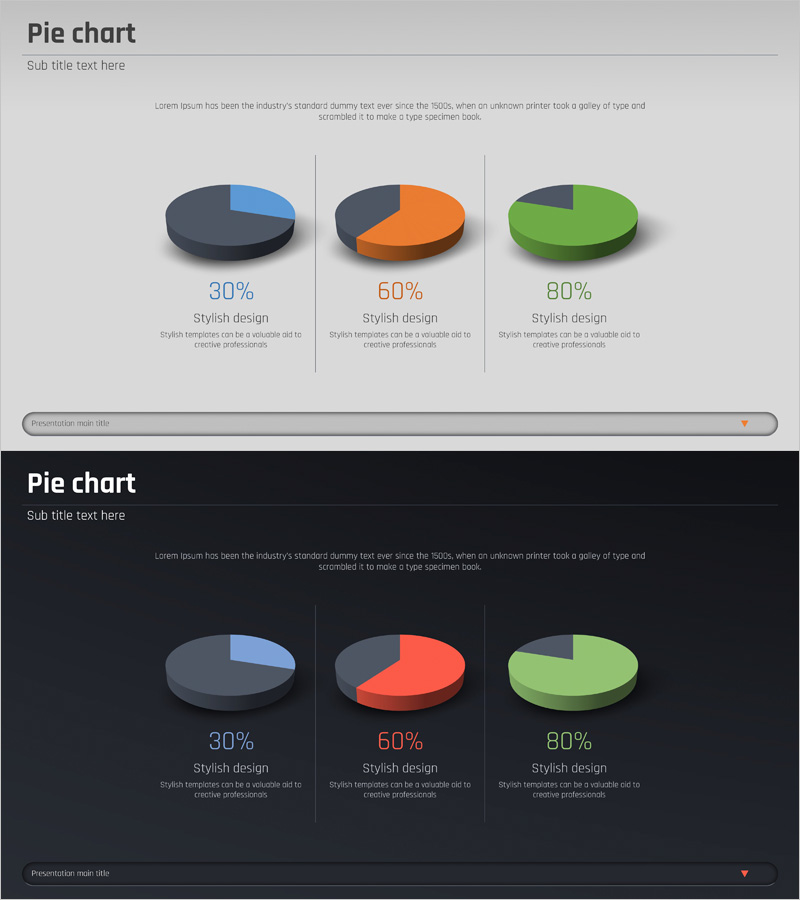
A professional 3D pie chart PowerPoint slide designed to visualize market share, competitive analysis, and proportional data with clarity and impact. This template includes two design variations: a light gray background version and a dark background version, each featuring three pie charts with blue, orange, and green color-coded segments representing 30%, 60%, and 80% data points. The pre-formatted layout with editable text areas below each chart allows for immediate customization. Ideal for executive presentations, investor pitches, market analysis reports, and business performance reviews where ratio-based information needs clear visual communication.
Usage Points
-
Main Usage
Effectively communicate proportional data such as market share, sales composition, customer distribution, and budget allocation. The three-segment design enables quick visual comparison of relative sizes, making it ideal for executive briefings, investor presentations, strategic planning sessions, and competitive analysis reports.
-
How to Use
Double-click the pie chart to edit data values and modify segment colors directly in PowerPoint. Choose the light background version for bright conference rooms and the dark version for dimly lit venues or video recording. Add context and insights in the text area below each chart to emphasize key findings and business implications.
-
Recommended For
Executive and C-suite quarterly performance reviews, marketing team market analysis and competitor benchmarking presentations, finance team budget composition explanations, sales team customer portfolio analysis, management consulting industry analysis reports, and startup investor pitch decks requiring clear market positioning.
-
Slide Structure
2-slide template. Slide 1: Light gray background with three 3D pie charts (30%, 60%, 80% segments) arranged left-center-right, each with percentage labels and editable text descriptions below. Slide 2: Identical layout with dark background. 16:9 widescreen format, PPTX file with all elements fully editable and customizable.
Related Products
-

Modern Theme Pie Chart – Market Share Analysis
#Product/Service Introduction #Market and Competitor Analysis #Graph
-

Brand Awareness Distribution Chart – Market Share Analysis
#Product/Service Introduction #Market and Competitor Analysis #Graph
-

4 Donut Charts for Data Visualization – Easy Presentation Template
#Product/Service Introduction #Market and Competitor Analysis #Graph
-

Purchase Volume Comparison Analysis Circle Graph – Understanding Market Share
#Product/Service Introduction #Market and Competitor Analysis #Graph
