3D Diagram of the 3-Step Process
RJ0400026_32
- Last Update 10/06/2025
- File Size 2.7MB
- # of Slides 2
- File Format PPTX
- Slide Ratio 16:9
- Color
Keywords
About the Product
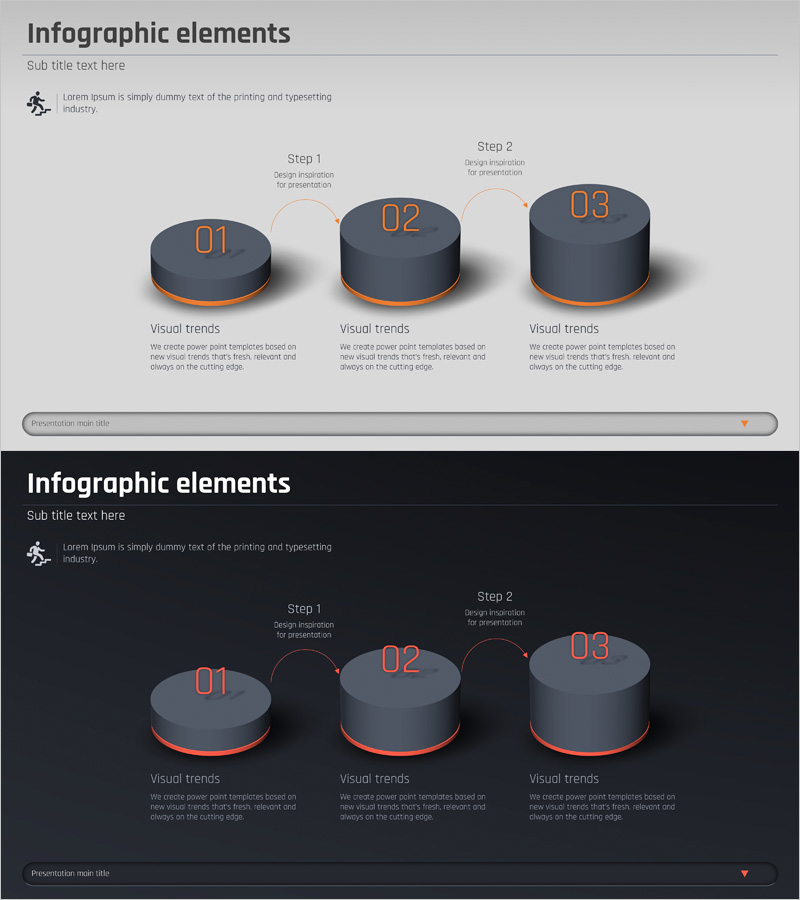
A PowerPoint slide featuring a 3-step business process visualized through 3D circular diagrams with sequential flow. The design includes a dark gray background with orange accent lines that emphasize each stage in three-dimensional form. Two slide versions are provided—one with a light background and one with a dark background—allowing you to select the best fit for your presentation environment. Each step includes a description area below the diagram where you can add detailed content such as strategy, execution details, or outcomes. This slide deck is ready to use for business strategy presentations, project phase explanations, marketing campaign roadmaps, and organizational change initiatives.
Usage Points
-
Main Usage
Clearly visualize business processes, project phases, and strategic execution roadmaps through a 3-step linear flow. The 3D cylindrical shapes and orange accent lines draw attention to each stage, helping audiences follow the sequential progression and understand the relationship between phases.
-
How to Use
Replace the numbers (01, 02, 03) with your stage names and fill in the text areas below each diagram with step descriptions, objectives, responsibilities, timelines, or other relevant details. Use the light background version for daytime presentations and the dark version for evening events or projection environments.
-
Recommended For
Executives, project managers, marketing professionals, consultants, and educators who need to explain step-by-step processes. Ideal for business strategy presentations, organizational restructuring explanations, product launch roadmaps, change management programs, and training sessions.
-
Slide Structure
Two-slide layout: one with light gray background and one with dark gray background. Each slide displays three 3D cylindrical shapes arranged horizontally from left to right, each labeled with an orange-accented number (01, 02, 03). Below each shape is a 'Visual trends' label with an editable text area for detailed descriptions.
Related Products
-

Financial Business Process Diagram – Roadmap for Efficient Operations
#Business Strategy #Operational Plan #Diagram
-

Mobile Service Process – Stepwise Operation Strategy
#Business Strategy #Operational Plan #Diagram
-

The Effects of Smoking on the Human Body – Infographic Diagram
#Business Strategy #Operational Plan #Diagram
-

Artificial Intelligence Big Data System Process – Business Strategy Diagram
#Business Strategy #Operational Plan #Diagram
