Comparative Analysis 3D Cylinder Bar Graph – Market and Competitor Analysis
RJ0400026_10
- Last Update 05/24/2025
- File Size 0.3MB
- # of Slides 2
- File Format PPTX
- Slide Ratio 16:9
- Color
Keywords
- #Content-Based Slides
- #Design-Based Slides
- #Market and Competitor Analysis
- #Graph
- #Competitor Analysis
- #Competitive Advantage
- #Column
- #Column Chart
- #16:9
- #3D cylinder bar chart PowerPoint
- #comparative analysis slide template
- #market analysis chart
- #competitor analysis PowerPoint
- #3D column chart template
- #data comparison presentation slide
About the Product
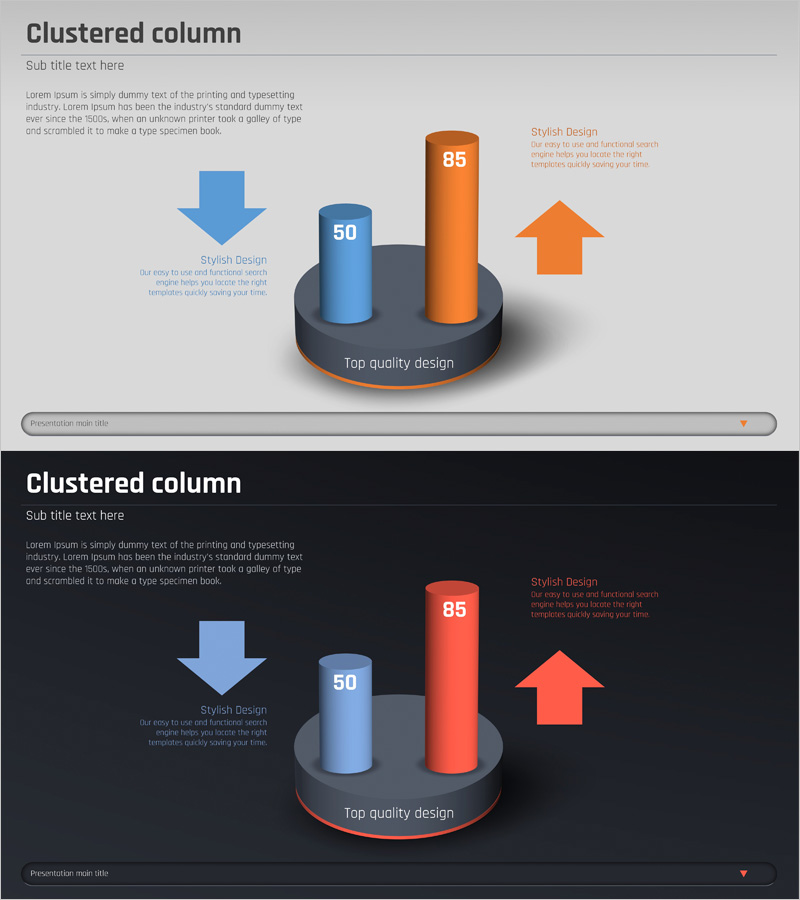
A professional 3D cylinder bar chart PowerPoint slide optimized for market analysis and competitive comparison presentations. The design features two data series represented in blue and orange cylindrical columns with dimensional depth, complemented by directional arrows and text annotations to highlight key insights. Two background versions—light and dark—are included to adapt to different presentation environments. The 2-slide template is fully editable with 16:9 widescreen format, allowing you to input actual data and customize labels for immediate use in business presentations.
Usage Points
-
Main Usage
Visually compare two or more data series using 3D cylindrical columns with dimensional impact. Ideal for market size comparisons, competitive performance benchmarking, quarterly revenue trends, product performance analysis, and any quantitative comparison requiring visual emphasis.
-
How to Use
Open the slide and adjust the cylinder heights and colors to match your data values. Edit the text labels and annotations to reflect your analysis subjects and key messages. Use the light background version in bright conference rooms and the dark version in dimly lit auditoriums for optimal readability.
-
Recommended For
Executive reports, investor presentations, marketing strategy pitches, sales presentations, consulting proposals, and business analysis reports. Recommended for executives, marketing managers, sales leaders, consultants, and data analysts who need to emphasize quantitative comparisons.
-
Slide Structure
Each slide features a central circular platform with two 3D cylinders (blue and orange) positioned above and below directional arrows with text callouts highlighting comparison points. Title area at top, legend and supplementary description space at bottom for clear data context.
Related Products
-

Research Analysis Vertical Bar Chart
#Market and Competitor Analysis #Graph #Competitor Analysis
-

Comparative Analysis Graph – Market and Competitor Analysis
#Market and Competitor Analysis #Graph #Competitor Analysis
-

Dual Column Chart by Quarter – Market Analysis and Competitive Advantage
#Market and Competitor Analysis #Graph #Competitor Analysis
-

Camera Comparison Competitive Analysis Slide - Data-Driven Strategy
#Market and Competitor Analysis #Graph #Competitor Analysis
