Financial Business Triangle Diagram – Visualization of Business Areas
RJ0400026_9
- Last Update 05/25/2025
- File Size 0.3MB
- # of Slides 2
- File Format PPTX
- Slide Ratio 16:9
- Color
Keywords
- #Content-Based Slides
- #Design-Based Slides
- #Company Introduction
- #Business Introduction
- #Diagram
- #Business Areas
- #Business Areas
- #Cluster
- #Spread
- #Chain Diagram
- #Decentralized Diagram
- #16:9
- #3-node radial diagram PowerPoint
- #central hub diagram slide
- #financial business presentation template
- #business area visualization PPT
- #radial diagram slide design
About the Product
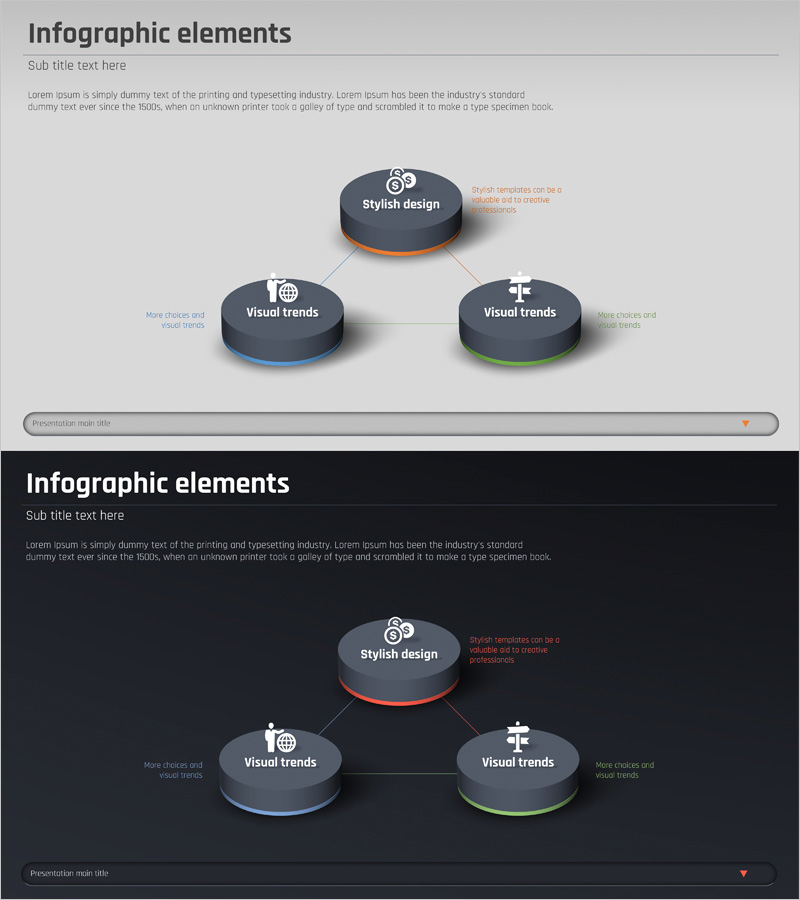
A radial diagram PowerPoint slide featuring three circular nodes converging toward a central hub, ideal for visualizing business areas, core strategies, and organizational structures in financial and business contexts. The design uses a dark gray background with distinct color-coded node borders—blue, orange, and green—to clearly differentiate each element. This 2-slide PPTX template in 16:9 widescreen format allows you to input icons and text directly into each node for immediate use. Colors and layouts are fully editable to match your presentation needs.
Usage Points
-
Main Usage
Visualize business areas, core strategies, organizational structures, or business models by converging three key elements toward a central concept in financial and business presentations. Ideal for investor pitch decks, business plan presentations, organizational restructuring announcements, and strategic planning sessions where complex information needs intuitive visual representation.
-
How to Use
Enter business area names, strategy items, or department names into each outer node's text field. Place the core concept (e.g., Business Strategy, Organizational Structure, Business Model) in the central node. Customize node border colors to match your presentation theme and replace icons to align with your content context.
-
Recommended For
Financial institutions, insurance companies, investment firms, consulting agencies, and large enterprises presenting organizational structures or business models. Suitable for CFOs, strategy managers, business development professionals, and executives delivering strategic presentations.
-
Slide Structure
2-slide template with radial layout: one central circular node connected to three surrounding nodes via linear connector lines. Dark gray background with color-coded node borders (blue, orange, green). 16:9 widescreen PPTX format optimized for all screen sizes and presentation platforms.
Related Products
-

Core Business Area Diagram – Segmentation and Expansion
#Company Introduction #Business Introduction #Diagram
-

Internet of Things Service Area Diagram – Business Introduction and Visualization
#Company Introduction #Business Introduction #Diagram
-

Space Industry Diffusion Diagram – Innovative Business Model Introduction
#Company Introduction #Business Introduction #Diagram
-

Company Stock Analysis Diagram – Stylish Design for Presentations
#Company Introduction #Business Introduction #Diagram
