Financial Business Process Diagram – Roadmap for Efficient Operations
RJ0400026_8
- Last Update 05/25/2025
- File Size 0.3MB
- # of Slides 2
- File Format PPTX
- Slide Ratio 16:9
- Color
Keywords
- #Content-Based Slides
- #Design-Based Slides
- #Business Strategy
- #Operational Plan
- #Diagram
- #Step-by-Step Schedule Plan
- #Business Processes
- #Flow
- #Linear Flow
- #16:9
- #financial process diagram
- #business process PowerPoint
- #operations roadmap presentation
- #step-by-step process slide
- #financial workflow diagram
- #process diagram PowerPoint slide template
About the Product
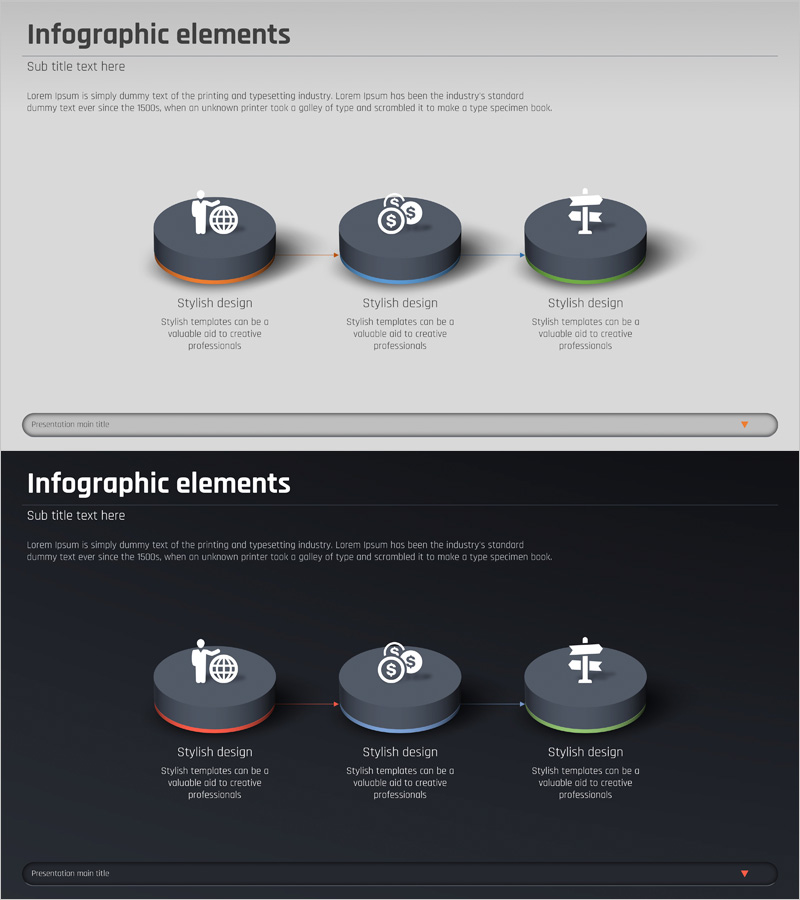
A PowerPoint slide that visualizes the core operational process of financial business through a 3-step linear diagram. Featuring a dark gray background with icons and text areas, this slide clearly represents each stage of workflow. This PPT template is ready to use for financial institution operational planning presentations, business process explanations, and phased schedule planning. Composed of 2 slides in 16:9 widescreen format, you can freely edit the icons and text in each node to match your specific needs.
Usage Points
-
Main Usage
This slide is designed to explain the core operational processes of financial institutions stage by stage and clearly visualize the connections between each stage. It enhances audience understanding when presenting business operation efficiency improvements, process improvement plans, and system implementation roadmaps.
-
How to Use
Replace the node icons with finance-related icons and enter stage names and descriptions in the text areas. You can adjust the color theme to match your company's brand colors or duplicate nodes to add additional stages if needed. It can be used in various presentation scenarios including financial meetings, executive briefings, and client presentations.
-
Recommended For
Ideal for financial institution employees, financial consultants, business analysts, operations managers, and finance IT professionals explaining process improvements, system implementation plans, and operational efficiency initiatives. Particularly effective for visualizing regulatory compliance processes, customer service flows, and internal approval procedures.
-
Slide Structure
Composed of 2 slides, each featuring 3 circular nodes connected by arrows in a linear process diagram. The layout includes a title area at the top, 3 icon-embedded nodes in the center, and descriptive text areas at the bottom. Dark gray, blue, and green colored nodes distinguish each stage, with arrows representing the process flow.
Related Products
-

3D Diagram of the 3-Step Process
#Business Strategy #Operational Plan #Diagram
-

Green & Gray Template Wide Step Diagram
#Business Strategy #Operational Plan #Diagram
-

Artificial Intelligence Big Data System Process – Business Strategy Diagram
#Business Strategy #Operational Plan #Diagram
-

Artificial Intelligence Development Process Diagram – Business Strategy
#Business Strategy #Operational Plan #Diagram
