Competitor Analysis 3D Graph Slide – How to Gain Market Advantage
RJ0400026_15
- Last Update 05/24/2025
- File Size 0.2MB
- # of Slides 2
- File Format PPTX
- Slide Ratio 16:9
- Color
Keywords
- #Content-Based Slides
- #Design-Based Slides
- #Market and Competitor Analysis
- #Graph
- #Competitor Analysis
- #Competitive Advantage
- #Horizontal Bar
- #Segmented Horizontal Bar
- #16:9
- #100% stacked bar chart PowerPoint
- #stacked horizontal bar graph
- #ratio comparison slide
- #competitor analysis chart
- #market data visualization
- #PowerPoint graph slide template
About the Product
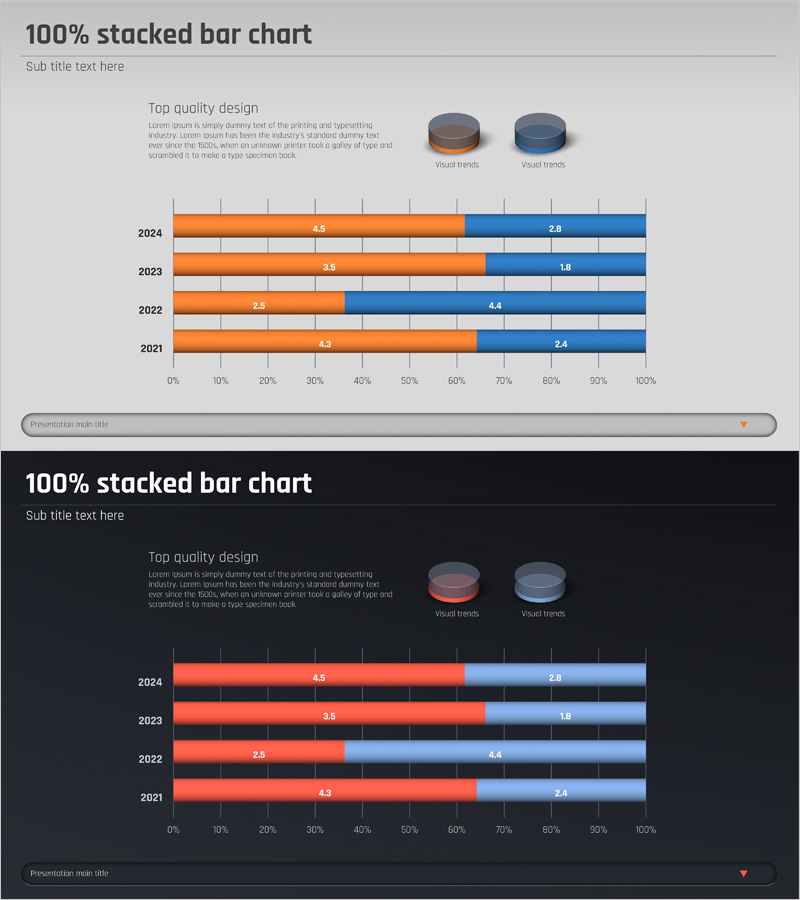
A 100% stacked horizontal bar chart PowerPoint slide optimized for competitor analysis and market comparison. The slide features two data series in orange and blue, displaying year-over-year ratios (2021–2024) with clear visual hierarchy. Each bar is normalized to 0–100% range, making proportion comparison intuitive, and numeric labels are included for precise data communication. The 16:9 widescreen format with 2-slide composition integrates seamlessly into business presentations, annual reports, and marketing strategy decks for market analysis sections.
Usage Points
-
Main Usage
Ideal for competitor analysis, market share comparison, and year-over-year ratio trend visualization. The 100% normalized baseline ensures relative proportions are immediately clear, making it perfect for comparing competitive positioning or product category distribution. The two-color scheme (orange and blue) creates strong visual contrast for effective comparison.
-
How to Use
Replace the displayed values with your own data by editing the numeric labels and bar proportions. Adjust the orange and blue percentages for each year row to reflect actual market data, and update category labels with competitor names or product names. Colors are fully customizable to match your corporate brand palette.
-
Recommended For
Executive reports, business plans, marketing strategy presentations, investor pitch decks, and quarterly/annual performance reports. Particularly effective for market share comparison against competitors, product category revenue distribution, customer segment composition, and financial/strategic analysis sections.
-
Slide Structure
2-slide set. Each slide contains a title area, descriptive text, and a 100% stacked horizontal bar chart. The chart displays 4 years (2021–2024) with 2 data series (orange and blue), with numeric labels embedded in each bar segment. Two design variants are included: light background and dark background versions for flexible presentation environment compatibility.
Related Products
-

Big Data Field Analysis Graph – Horizontal Bar Chart Showing Competitive Advantage
#Market and Competitor Analysis #Graph #Competitor Analysis
-

Comparative Analysis Detailed Bar Graph – Optimal Tool for Competitor Analysis
#Market and Competitor Analysis #Graph #Competitor Analysis
-

Music Competitive Advantage Graph for Strategic Analysis
#Market and Competitor Analysis #Graph #Competitor Analysis
-

Comparison Bar Graph of Two Topics – Essential Template for Market Analysis
#Market and Competitor Analysis #Graph #Competitor Analysis
