Business Connection 3D Diagram – Business Strategy
RJ0400026_16
- Last Update 05/24/2025
- File Size 0.3MB
- # of Slides 2
- File Format PPTX
- Slide Ratio 16:9
- Color
Keywords
- #Content-Based Slides
- #Design-Based Slides
- #Business Strategy
- #Operational Plan
- #Diagram
- #Step-by-Step Schedule Plan
- #Business Processes
- #Cluster
- #Chain Diagram
- #16:9
- #3D connection diagram PowerPoint
- #business connection slide template
- #strategy flow diagram
- #operational planning PPT
- #node connection diagram PowerPoint
About the Product
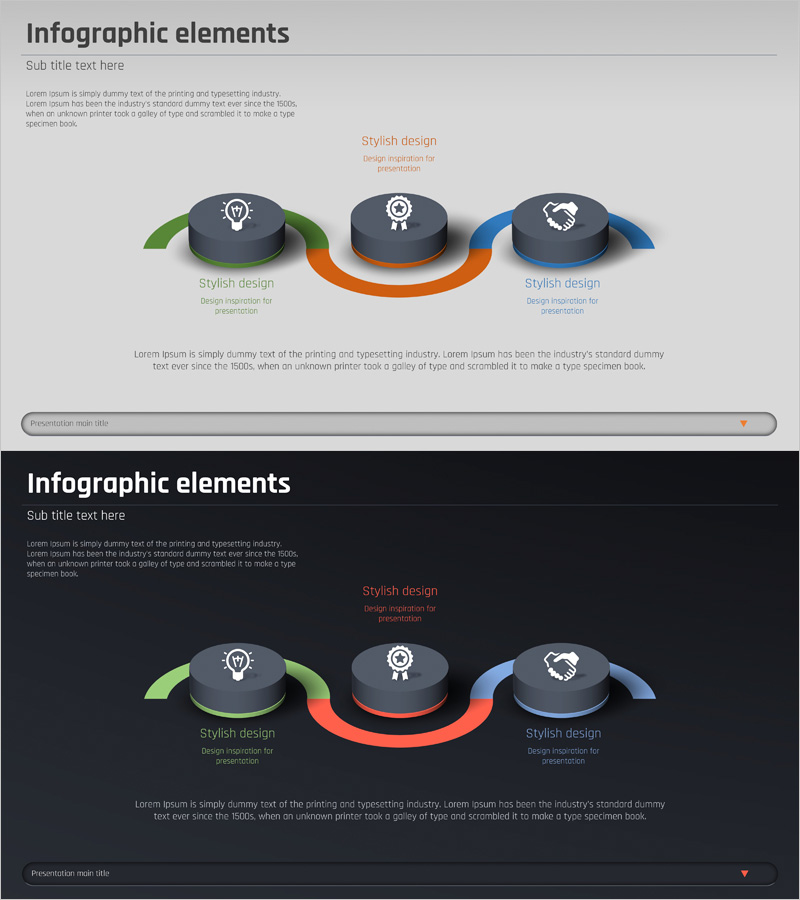
A 3D connection diagram PowerPoint slide that visualizes business strategy and operational planning. The design features a central gear icon connected to a left lightbulb icon and a right handshake icon via orange curved arrows, intuitively expressing the interconnectedness of business processes. Dark gray 3D cylindrical nodes combined with colorful arrow elements add depth to your presentation, while text areas below each node allow for detailed descriptions. Composed of 2 slides in 16:9 widescreen format, this PPT template is ready for immediate use in corporate presentations, strategy meetings, and business plan explanations.
Usage Points
-
Main Usage
Visualize business strategy, operational planning, interdepartmental collaboration, and business process flows using a 3D connection diagram to clearly communicate interconnectedness and integration to your audience. Ideal for executive briefings, strategy meetings, and business presentations where core messages need visual emphasis.
-
How to Use
Enter your core strategy or objective in the central gear node, add innovation or idea elements in the left lightbulb node, and include partnership or collaboration content in the right handshake node. Add detailed explanations in the text areas below each node to describe your complete business ecosystem.
-
Recommended For
Executive and management briefings, business development strategy meetings, marketing planning presentations, consulting project proposals, investor pitch decks, organizational restructuring explanations, and supply chain management discussions. Particularly effective for explaining multi-departmental collaboration, strategic partnerships, and integrated business ecosystems.
-
Slide Structure
2-slide set with identical layout. Each slide features a central gear icon connected to a left lightbulb and right handshake icon via orange curved arrows in a 3-node configuration. Design includes dark gray 3D cylindrical nodes, colorful arrows in green, orange, and blue, and editable text input areas beneath each node.
Related Products
-

Game Business Process Diagram - Visualization of Business Strategy
#Business Strategy #Operational Plan #Diagram
-

Business Processes by Business Hours Slide – Efficient Operations Planning
#Business Strategy #Operational Plan #Diagram
-

Business Process Diagram – Optimizing Workflow
#Business Strategy #Operational Plan #Diagram
-

Visualizing the IoT Service Process – Incorporating Business Strategy
#Business Strategy #Operational Plan #Diagram
