Competitor Analysis Broken Line Graph – Market Dominance and Competitive Advantage
RJ0400026_22
- Last Update 05/24/2025
- File Size 0.2MB
- # of Slides 2
- File Format PPTX
- Slide Ratio 16:9
- Color
Keywords
- #Content-Based Slides
- #Design-Based Slides
- #Market and Competitor Analysis
- #Graph
- #Competitor Analysis
- #Competitive Advantage
- #Line
- #Line Chart
- #16:9
- #line chart PowerPoint
- #multi-series chart template
- #trend comparison slide
- #competitor analysis graph
- #market data visualization
- #line graph PowerPoint download
About the Product
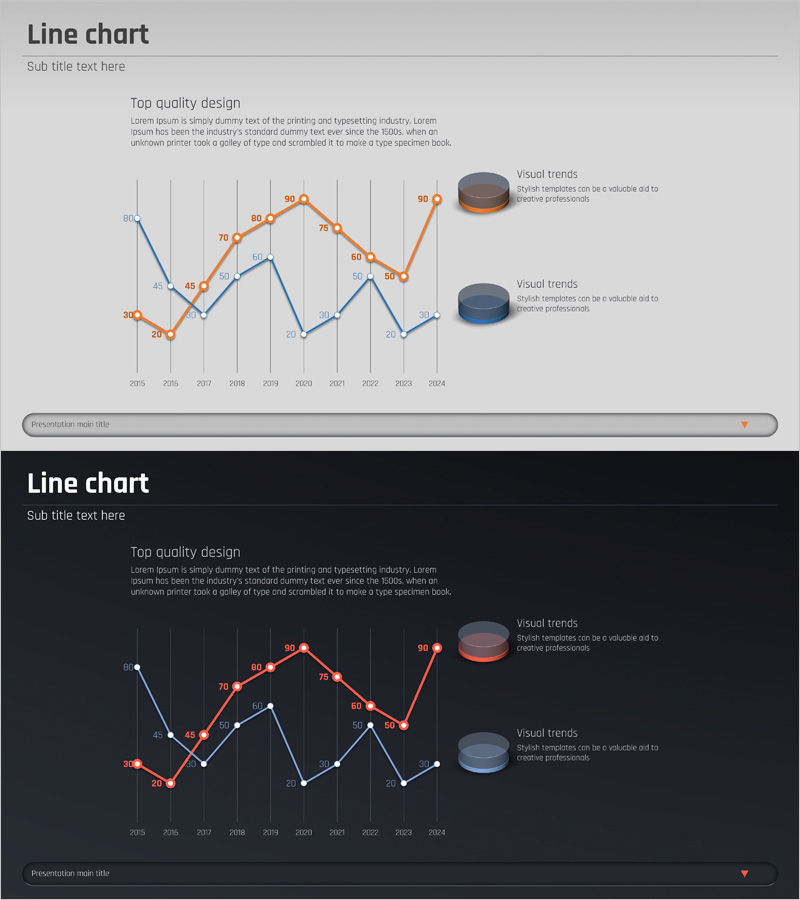
A PowerPoint line chart slide designed to compare data changes across two series over time. Available in both light and dark background versions, with each series displayed in distinct colors (orange and blue) for clear trend differentiation. Data points include numerical labels for precise value communication, and a legend with description area enables immediate use in presentations. This slide template is ideal for competitive analysis, market share trends, revenue forecasts, and various business presentations requiring multi-series data visualization.
Usage Points
-
Main Usage
This slide is optimized for comparing two or more data series across time periods. It works effectively for presenting competitor market share changes, revenue and cost trends, customer satisfaction evolution, and any business analysis requiring trend comparison and pattern identification.
-
How to Use
Input your data for each series and the line chart automatically renders. Modify series names in the legend area and add insights in the right description section to strengthen presentation context. Choose between light or dark background versions based on your presentation environment and display setup.
-
Recommended For
Recommended for executive reports, marketing teams, sales presentations, and analytical teams. Particularly effective for competitive analysis briefings, market trend explanations, performance reviews, and quarterly business updates where data credibility is essential.
-
Slide Structure
Each slide contains one 2-series line chart. The horizontal axis displays years (2015–2024) and the vertical axis shows numerical scale. Each data point is labeled with precise values. A legend and description area on the right side allows for additional context and insights.
Related Products
-

Market Competitiveness Comparison Graph – Highlighting Competitive Advantage
#Market and Competitor Analysis #Graph #Competitor Analysis
-

Variation Graph for the Line Chart – Optimized Design for Market and Competitor Analysis
#Market and Competitor Analysis #Graph #Competitor Analysis
-

Broken Line Comparison Graph – Optimized for Market and Competitor Analysis
#Market and Competitor Analysis #Graph #Competitor Analysis
-

Default Line Graph for Market & Competitor Analysis – Competitive Advantage
#Market and Competitor Analysis #Graph #Competitor Analysis
