Business Bundle Bar Graph – Market Analysis and Competitive Edge
RJ0400026_33
- Last Update 05/24/2025
- File Size 3.1MB
- # of Slides 2
- File Format PPTX
- Slide Ratio 16:9
- Color
Keywords
- #Content-Based Slides
- #Design-Based Slides
- #Market and Competitor Analysis
- #Graph
- #Competitor Analysis
- #Competitive Advantage
- #Column
- #Grouped Column
- #16:9
- #clustered column chart PowerPoint
- #dual-series data comparison slide
- #market analysis presentation
- #competitive analysis chart
- #business data visualization template
About the Product
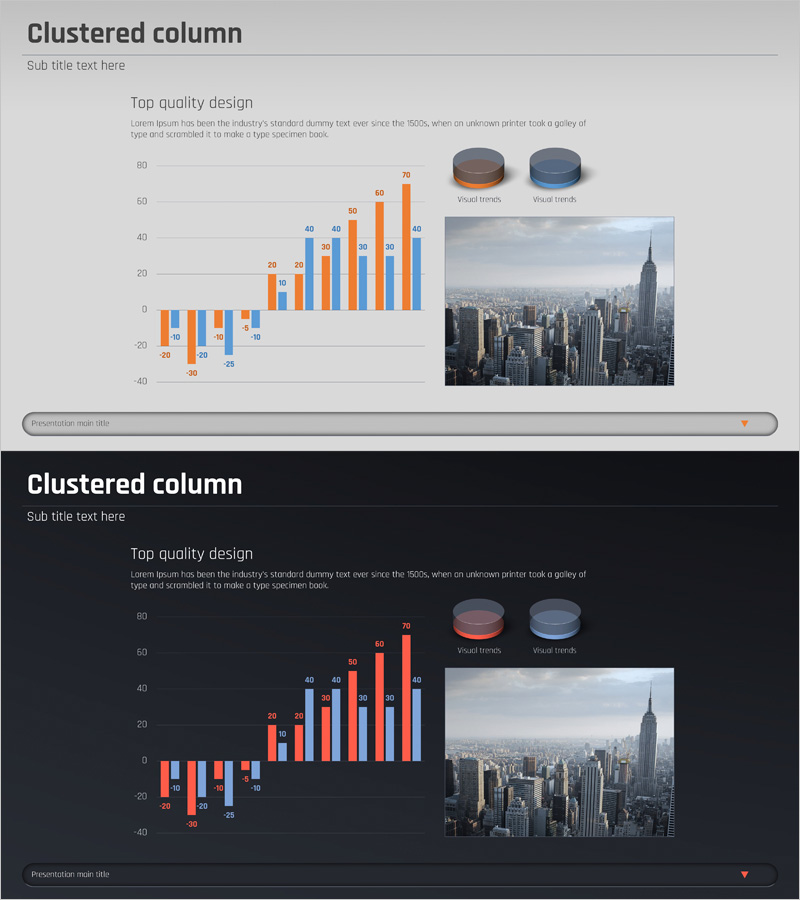
A professional clustered column chart PowerPoint slide designed for business presentations that compare two data series side by side. Featuring orange and blue color-coded bars, this slide effectively visualizes market analysis, competitive benchmarking, sales performance comparisons, and year-over-year trends. The chart supports negative values to display growth and decline simultaneously, making it ideal for financial reports and strategic presentations. Provided in both light and dark theme versions in 16:9 widescreen format across 2 slides for maximum flexibility.
Usage Points
-
Main Usage
Compare two data sets simultaneously to illustrate market share, competitor performance, departmental results, and multi-year trends. The dual-axis capability with negative value support enables comprehensive analysis of growth metrics, variance analysis, and performance deltas in a single visual.
-
How to Use
Double-click the chart to edit data values directly within PowerPoint, or link to external Excel files for automatic updates. Select between light theme (bright gray background) and dark theme (black background) versions depending on your presentation environment and display setup.
-
Recommended For
Marketing professionals presenting market research findings, sales teams conducting competitive analysis, finance departments reporting performance metrics, executive leadership briefings, and strategic planning sessions. Ideal for any business context requiring data-driven comparison and decision-making visualization.
-
Slide Structure
Two-slide template featuring light theme (light gray background) on slide 1 and dark theme (black background) on slide 2. Each slide includes title area, descriptive text, dual-series orange and blue clustered column chart, legend, two 3D pie charts labeled 'Visual trends', cityscape imagery, and presentation notes area.
Related Products
-

Market Competition: Deep Dive into Top 3 Firms
#Market and Competitor Analysis #Graph #Competitor Analysis
-

Analyzing 2 Comparison Graphs - Slides for Deriving Competitive Advantage
#Market and Competitor Analysis #Graph #Competitor Analysis
-

Triangular Pattern Column Chart Template – Market Competitive Advantage Analysis
#Market and Competitor Analysis #Graph #Competitor Analysis
-

Market Insights Through Competition Analysis Chart – Gaining Competitive Edge
#Market and Competitor Analysis #Graph #Competitor Analysis
