
Brainstorming Presentation Template – Effortless Design for Idea Sharing
J0300068
- Last Update 01/07/2025
- File Size 13.8MB
- # of Slides 30
- File Format PPTX
- Slide Ratio 16:9
- Color
Slide Preview


Keywords
About the Product
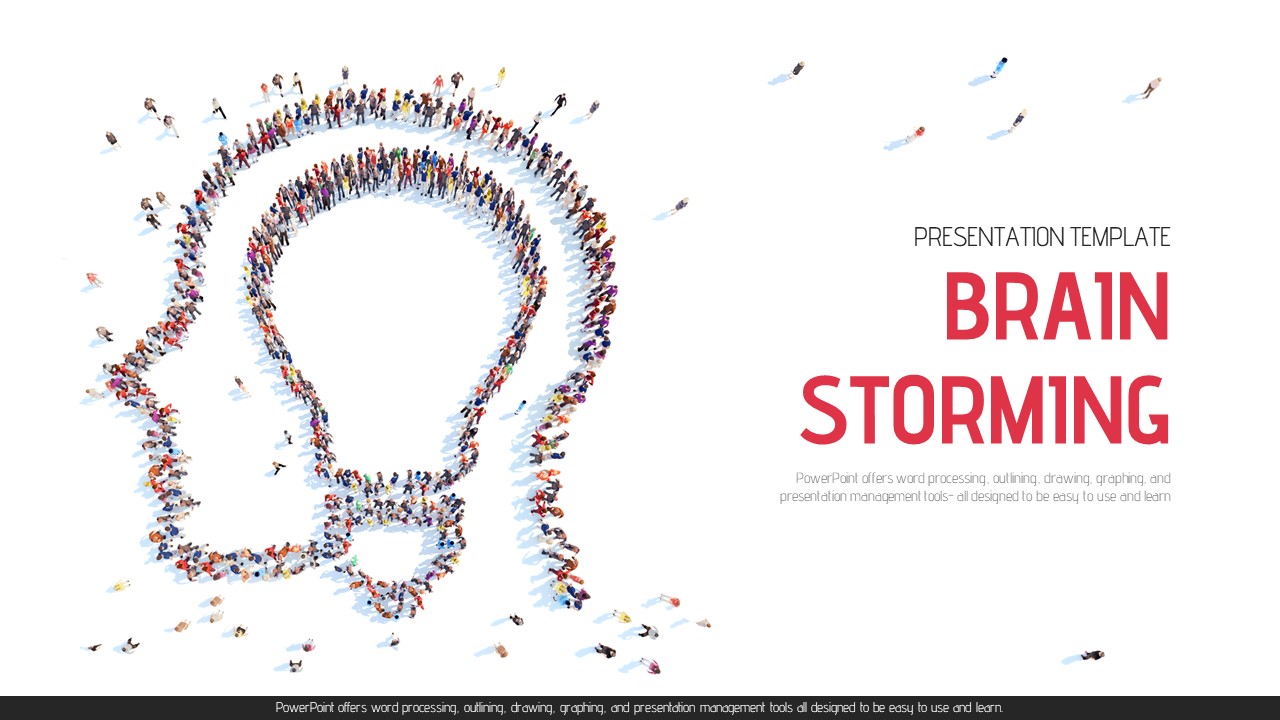
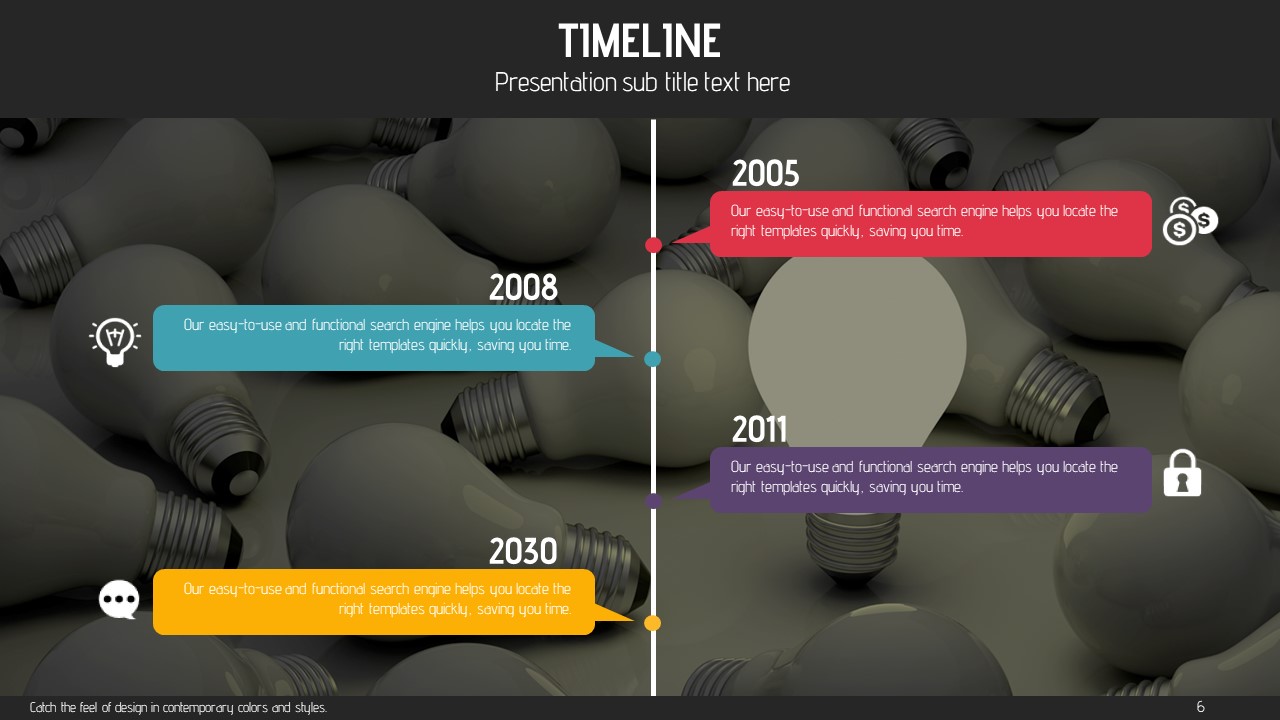
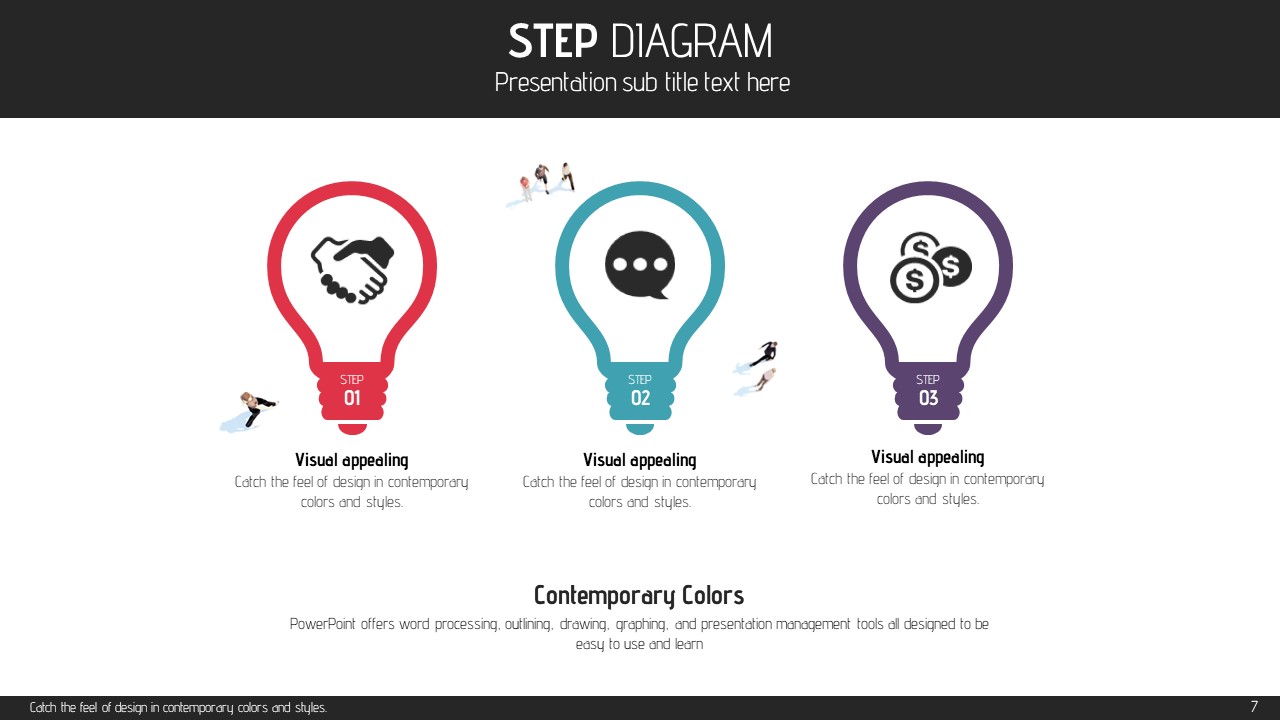
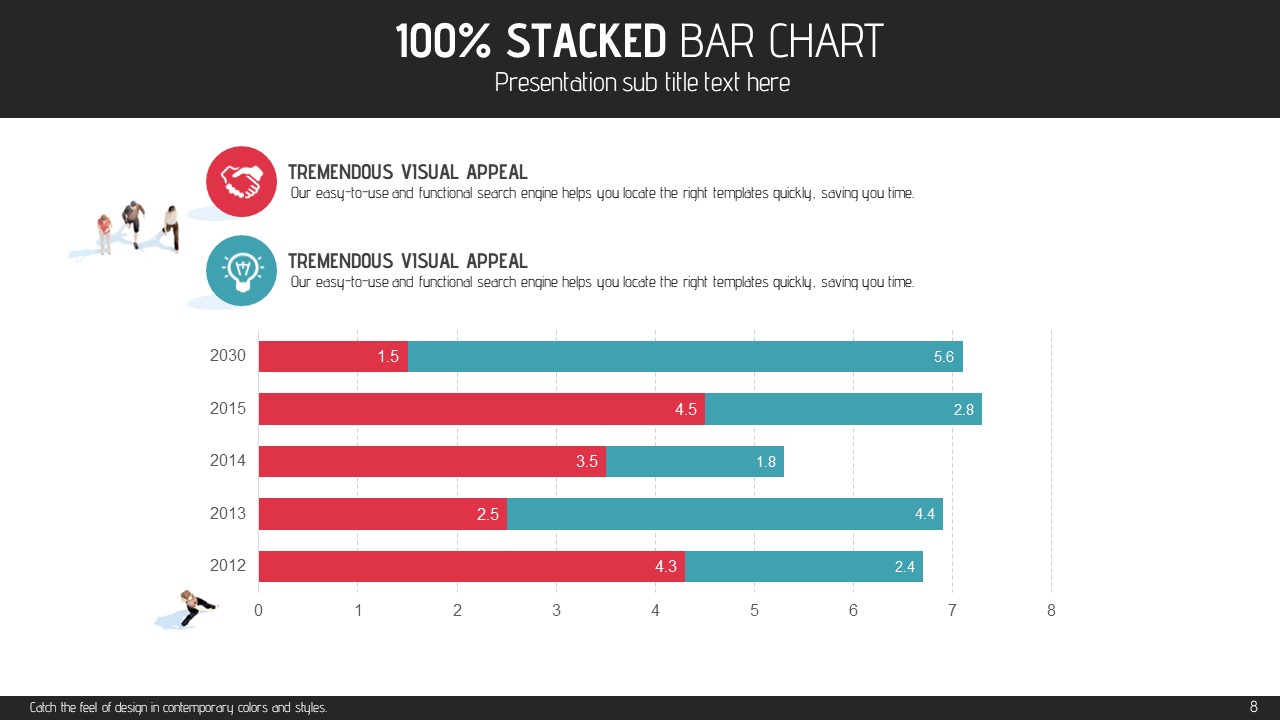
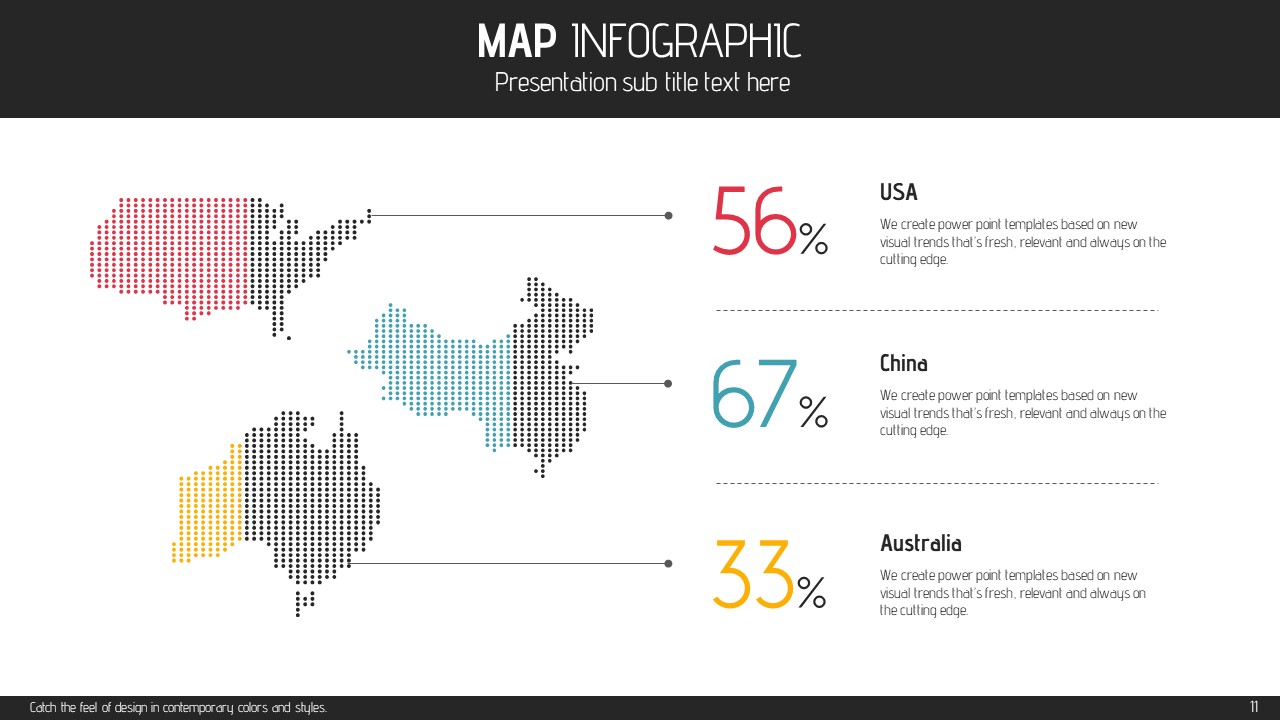
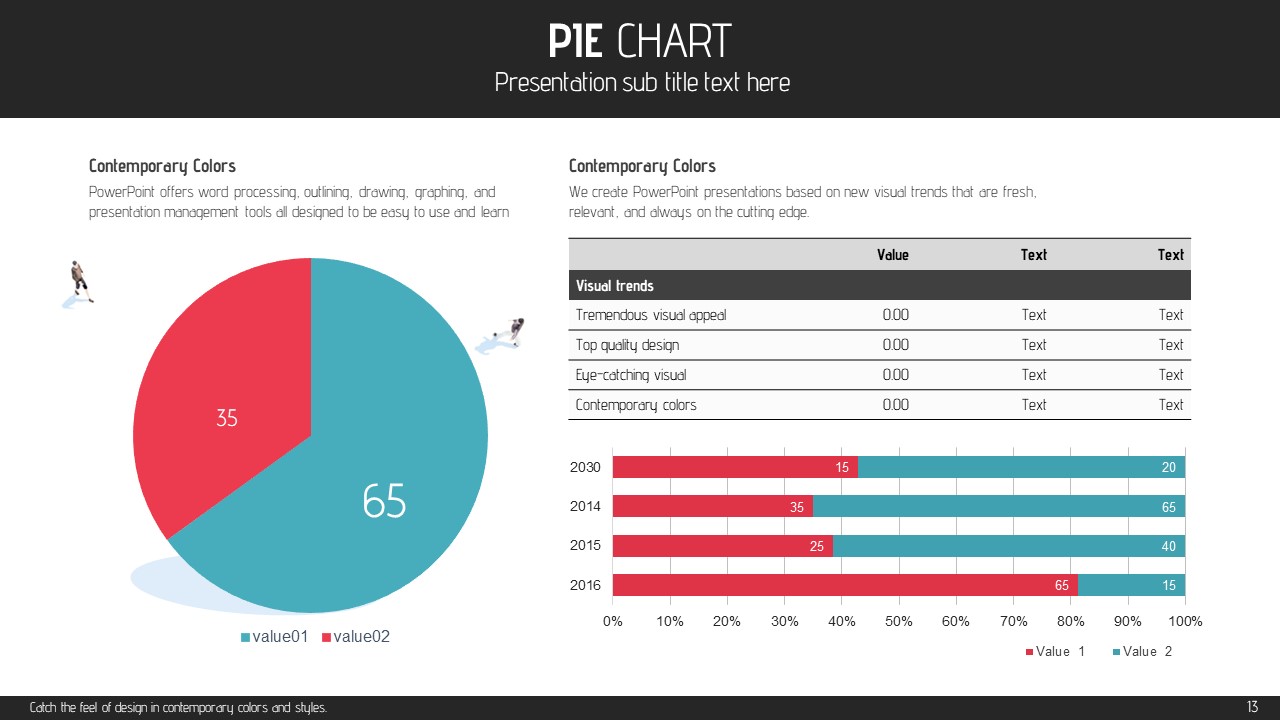
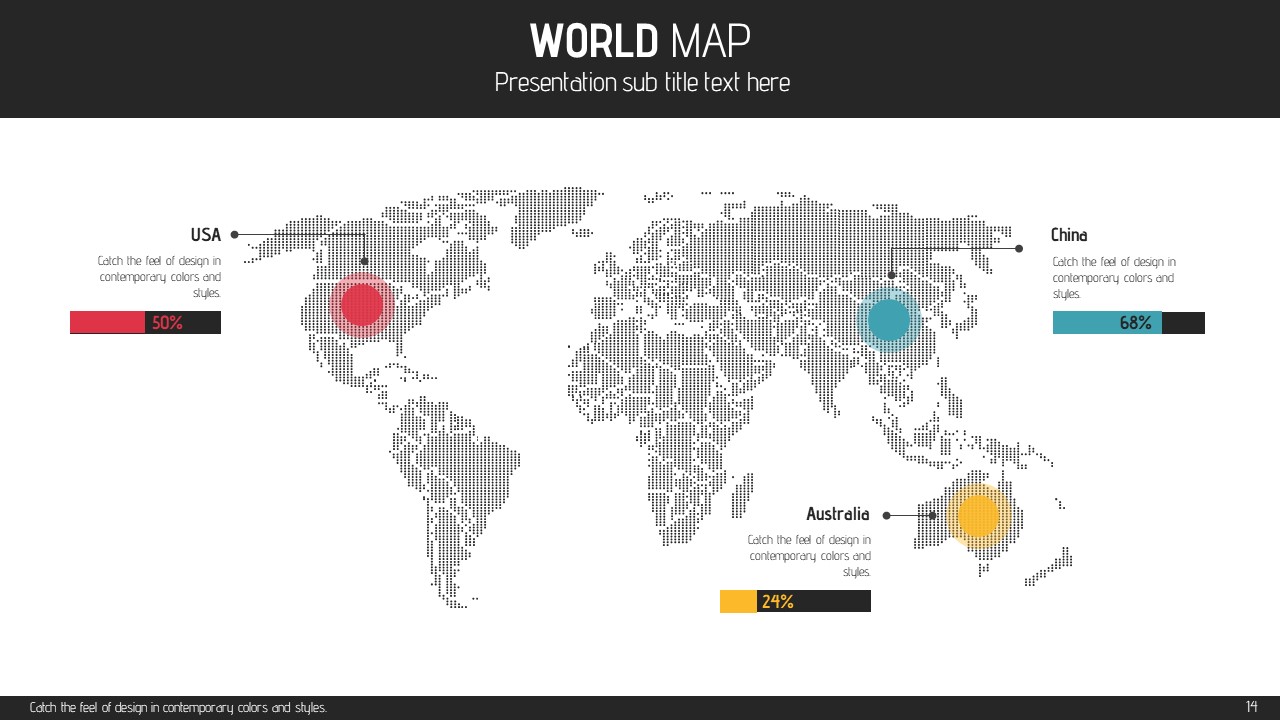
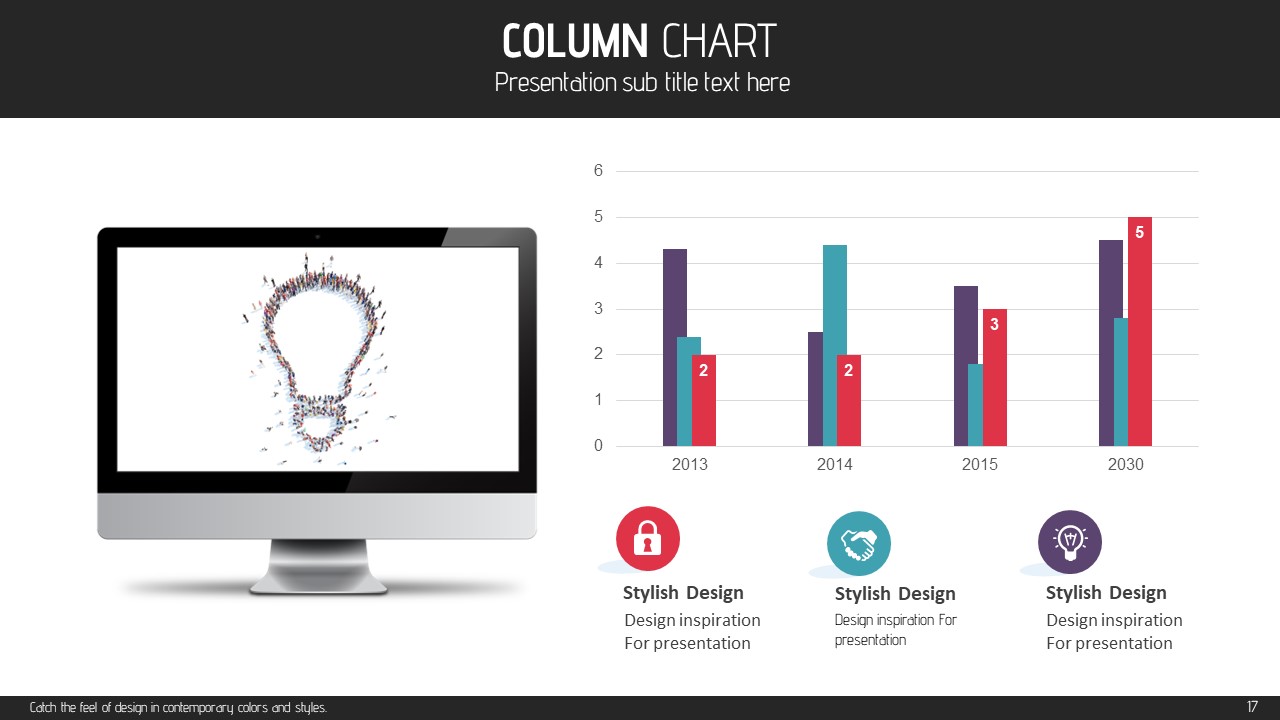
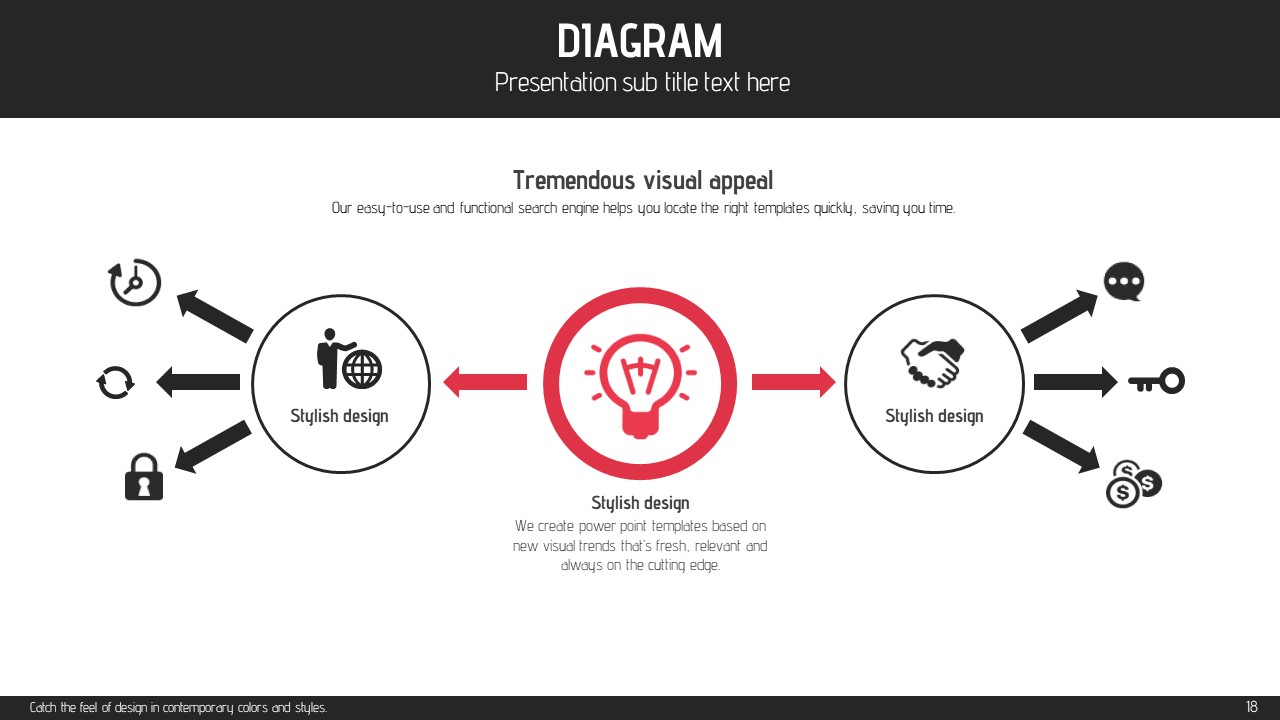
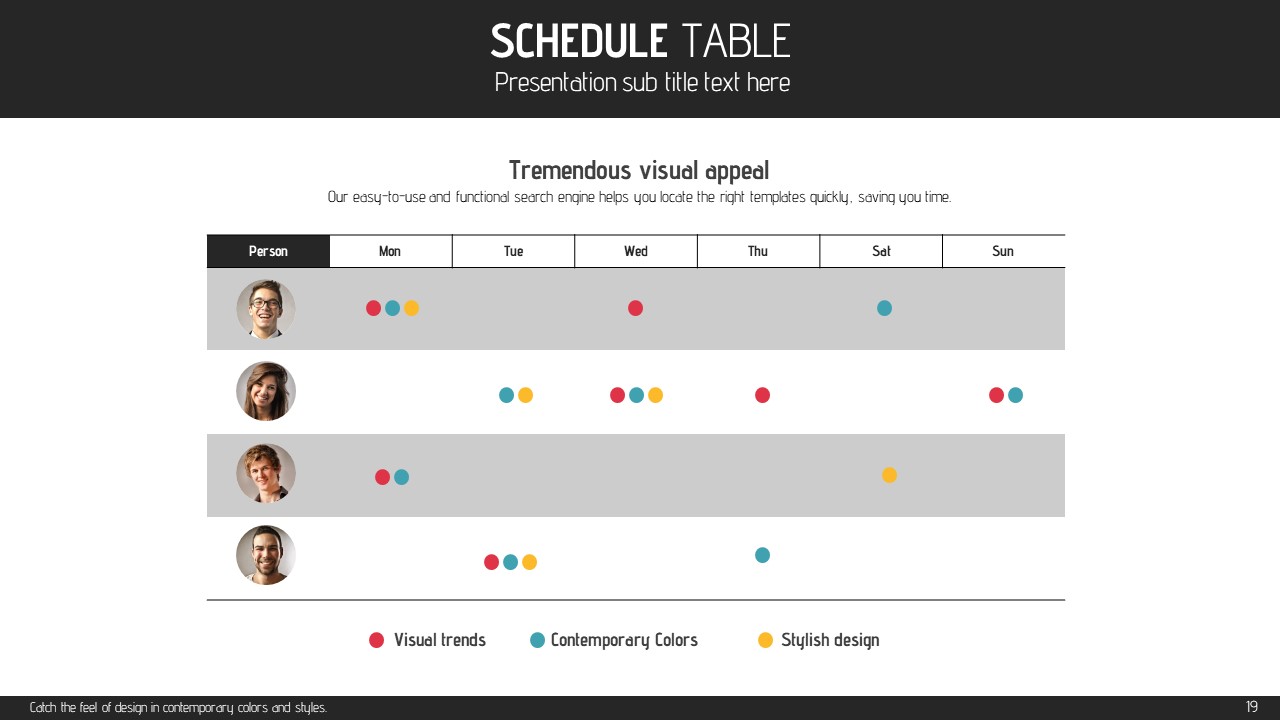
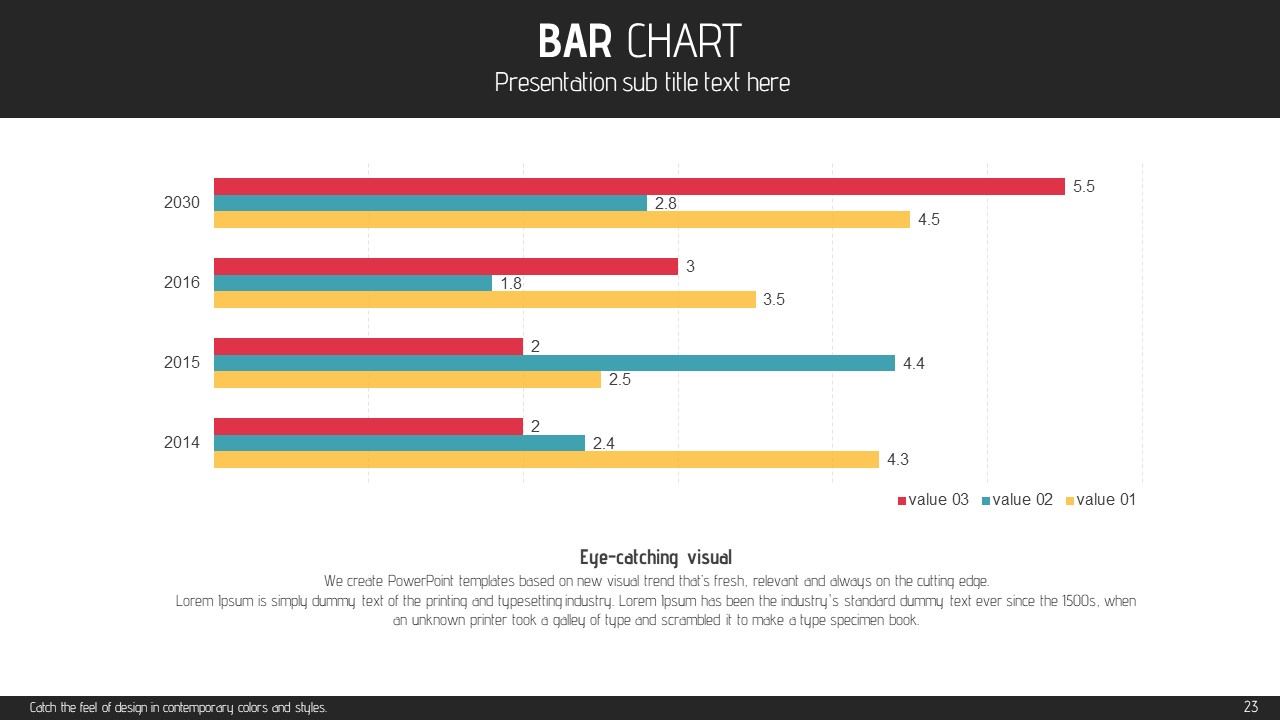
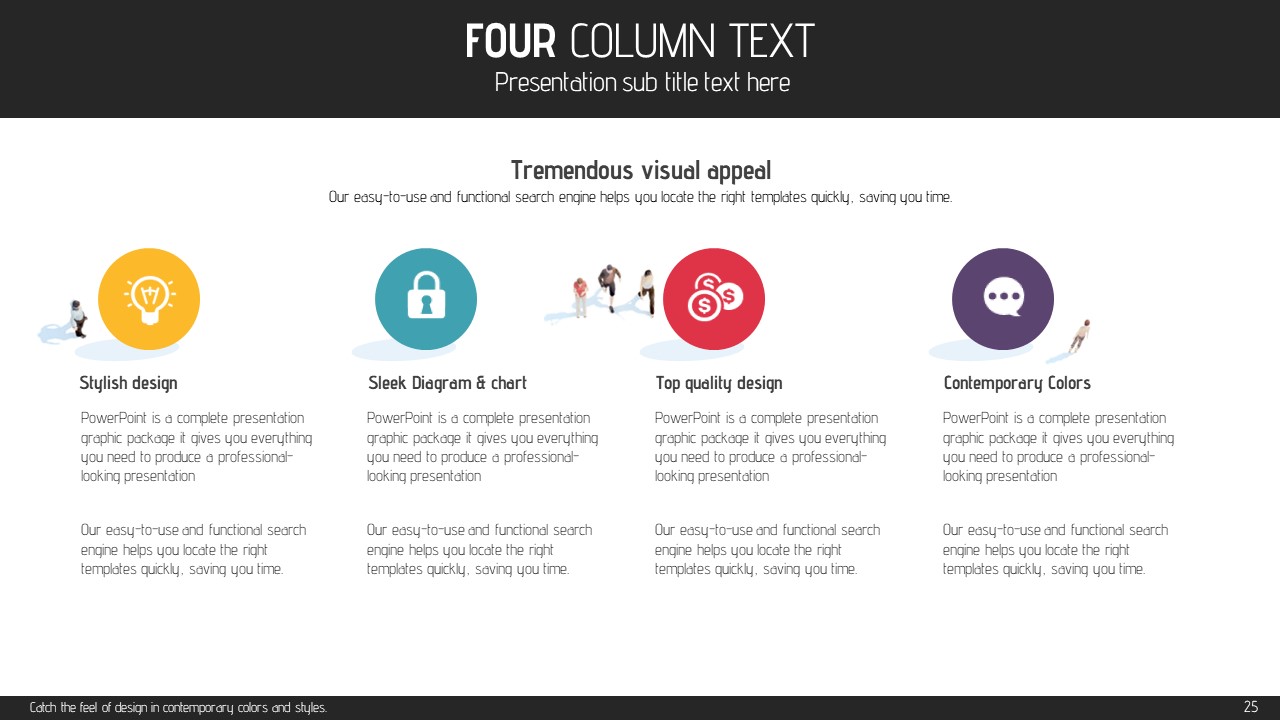
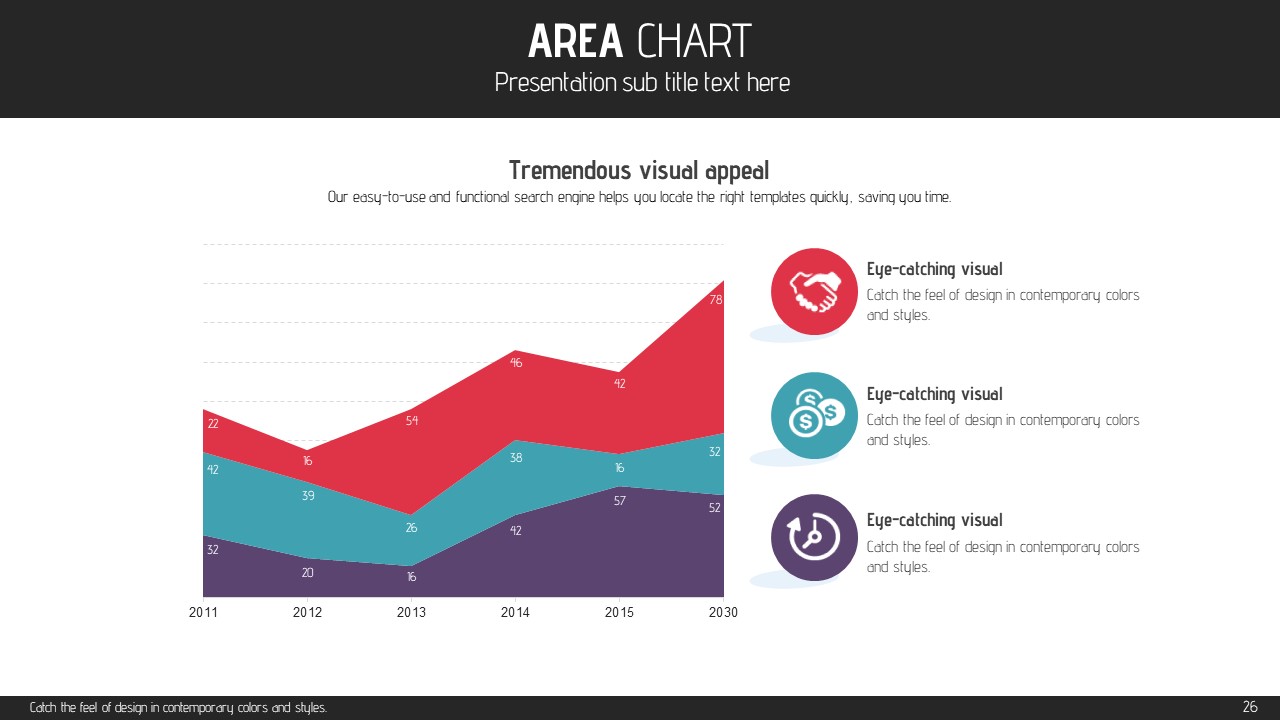
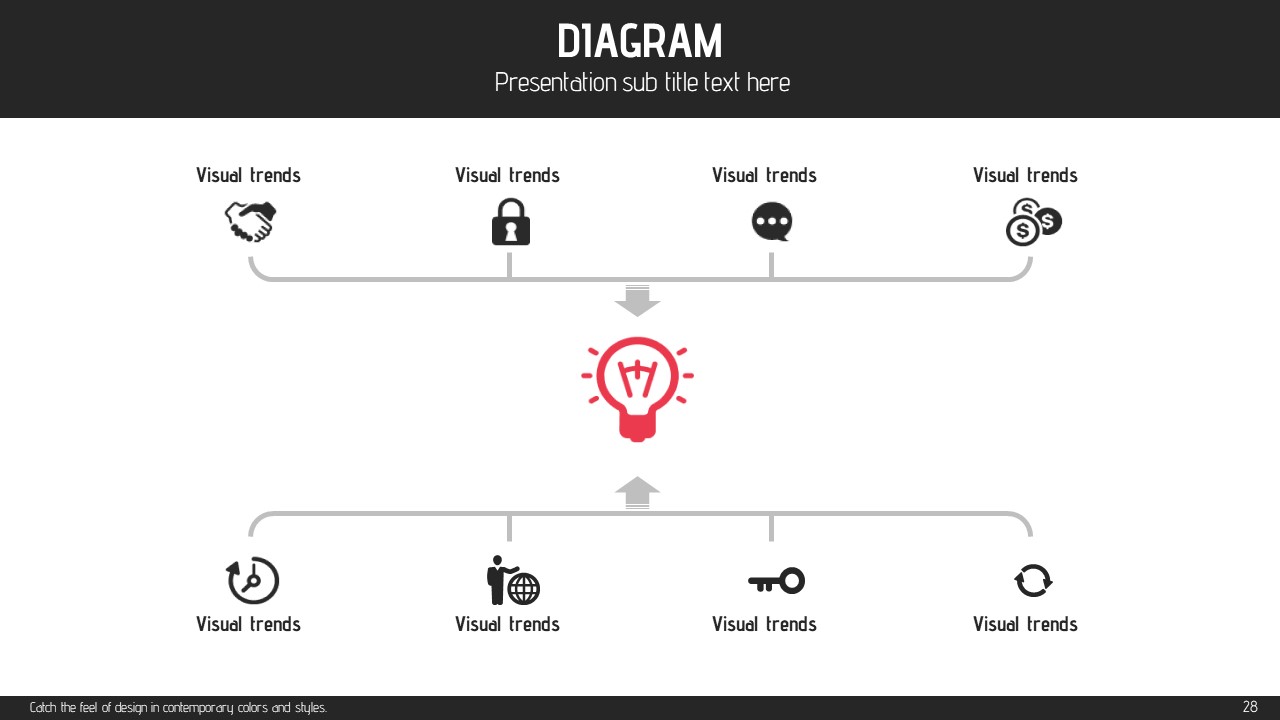
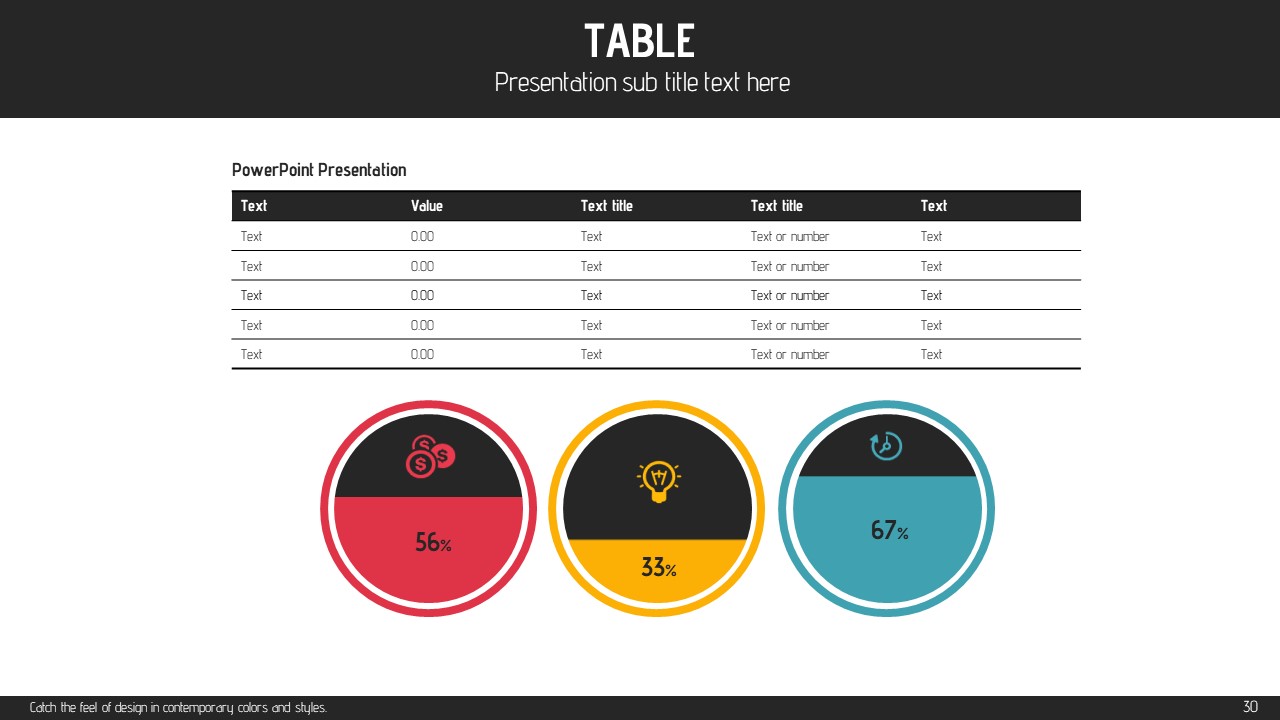
Make an immediate impact with this brainstorming-focused PowerPoint template featuring a striking cover slide where a crowd of people forms the shape of a light bulb. The clean white background is paired with bold black header bars and red accent colors, creating a high-contrast layout that keeps audiences engaged throughout your presentation. This 30-slide deck covers every stage of idea sharing and data visualization, including a dot-style map infographic, year-over-year column charts, a radar chart, circular icon diagrams, and icon card layouts. Each slide is fully editable in PPTX format, allowing you to swap text, figures, and images in minutes. Optimized for 16:9 widescreen displays and online meetings, this slide set is ideal for business workshops, strategy sessions, client pitches, and team brainstorming meetings where creative thinking needs to be communicated clearly and professionally.
Usage Points
-
Main Usage
Designed for team brainstorming sessions, idea pitches, and workshop facilitation, this PowerPoint template helps you present creative concepts and supporting data in a single cohesive slide deck that is ready to use immediately.
-
How to Use
Download the PPTX file and replace the placeholder text, numbers, and images with your own content. Use the map infographic slides for regional data, the column charts for year-over-year comparisons, and the icon diagram slides to illustrate key concepts or decision flows.
-
Recommended For
Best suited for marketing teams, business consultants, startup founders, and workshop facilitators who regularly lead idea-generation meetings or strategy presentations. Also recommended for educators and trainers running interactive seminars.
-
Slide Structure
30 slides total: crowd light bulb cover, dot-style world map infographic with country percentage callouts, multi-year column chart comparison, radar chart, circular icon diagram with dark background, and line icon card layout slides.
Related Products
-

Entertainment Company Presentation Template – Stylish and Colorful Design
#Business
-

Container PPT Wide Template – Efficient Business Presentation Design
#Business
-

Illustrated Folder Presentation Template – Stylish and Practical Design
#Business
-

Fountain Pen Theme Presentation – Elegant Business Slide Design
#Business
