Light Bulb Diagram Graph – Visualization of Business Vision and Strategy
RJ0300068_15
- Last Update 05/07/2025
- File Size 1.8MB
- # of Slides 2
- File Format PPTX
- Slide Ratio 16:9
- Color
Keywords
- #Content-Based Slides
- #Design-Based Slides
- #Business Vision and Strategy
- #Graph
- #Other
- #Business Background and Necessity
- #Circles
- #Pie Chart
- #Mockup
- #16:9
- #light bulb icon PowerPoint slide
- #vision strategy presentation template
- #business goal diagram
- #icon-based slide design
- #mockup PowerPoint template download
About the Product
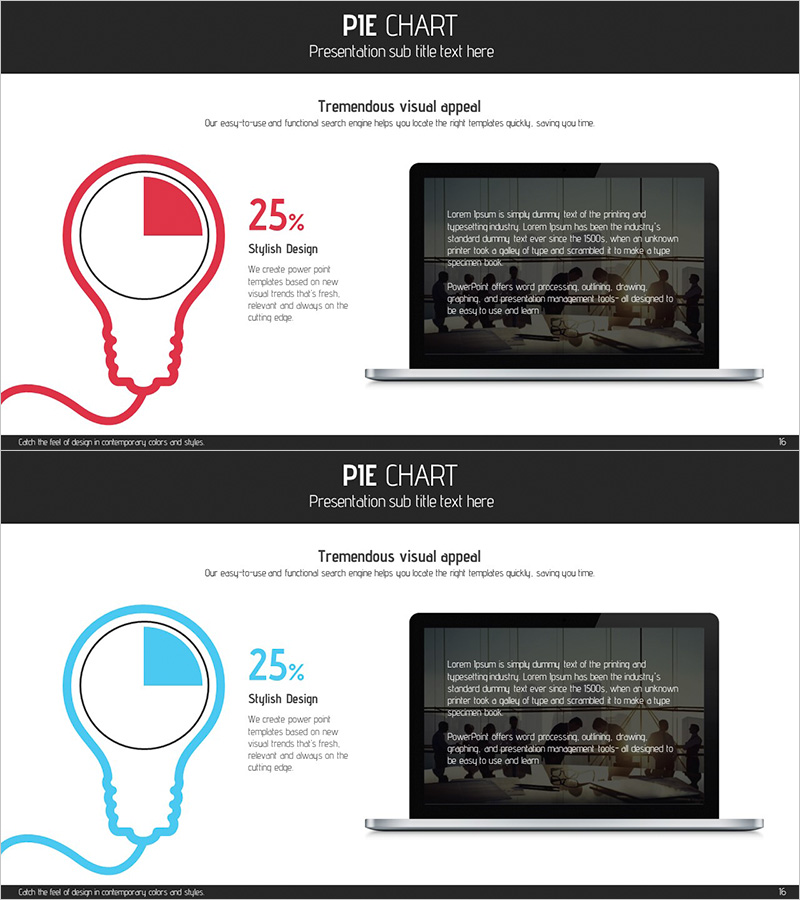
A professional PowerPoint slide featuring a light bulb icon design to visually represent business vision and strategy. The slide showcases two contrasting color variations—red and blue—with a bulb-shaped icon that emphasizes key messages, paired with a laptop mockup area on the right for descriptive text. This 2-slide template is optimized for 16:9 widescreen format and works seamlessly in PPTX. Perfect for executive presentations, strategic planning documents, and business reports where you need to communicate innovation, core objectives, and organizational direction. All elements are fully editable in PowerPoint, allowing you to customize colors, text, and numerical data to match your presentation needs.
Usage Points
-
Main Usage
Symbolize business vision, core strategy, and innovation ideas through a light bulb icon to capture audience attention and enhance message retention. Effectively communicate key objectives and organizational direction in executive briefings, strategic planning sessions, and investor pitch meetings.
-
How to Use
Enter your key message or metric (e.g., 25%) in the light bulb icon area on the left, and add detailed explanatory text in the laptop mockup section on the right. Modify colors to represent different scenarios or comparison items, and customize the title and subtitle to align with your presentation topic.
-
Recommended For
Executives, strategy managers, business development teams, marketing planners, consultants, and startup founders presenting business direction, innovation strategies, and core value propositions. Suitable for quarterly business reviews, new business proposals, and investment pitch presentations.
-
Slide Structure
2-slide template with consistent layout. Each slide features a light bulb icon (single node) in red or blue on the left with numerical text, paired with a laptop mockup image and text area on the right in a 2-column layout. Optimized for 16:9 widescreen format for modern presentation environments.
Related Products
-

Business Tablet Mockup Background Introduction – Business Vision and Strategy
#Business Vision and Strategy #Other #Business Background and Necessity
-

Five Color PowerPoint Template Wide – Donut Chart
#Product/Service Introduction #Business Vision and Strategy #Graph
-

Pie Chart Slide for Status of Service Technology Development
#Product/Service Introduction #Market and Competitor Analysis #Graph
-

Newspaper Wide PowerPoint Template Mockup
#Product/Service Introduction #Other #Product/Service Introduction
