Idea Development Analysis Chart – Data-Driven Innovation
RJ0300068_29
- Last Update 05/07/2025
- File Size 1.4MB
- # of Slides 2
- File Format PPTX
- Slide Ratio 16:9
- Color
Keywords
- #Content-Based Slides
- #Design-Based Slides
- #Product/Service Introduction
- #Business Introduction
- #Diagram
- #Graph
- #Other
- #Development Status
- #Technological Status
- #Table
- #16:9
- #data analysis chart PowerPoint
- #pie chart slide design
- #comparison analysis PPT
- #business analytics presentation
- #numerical data visualization
About the Product
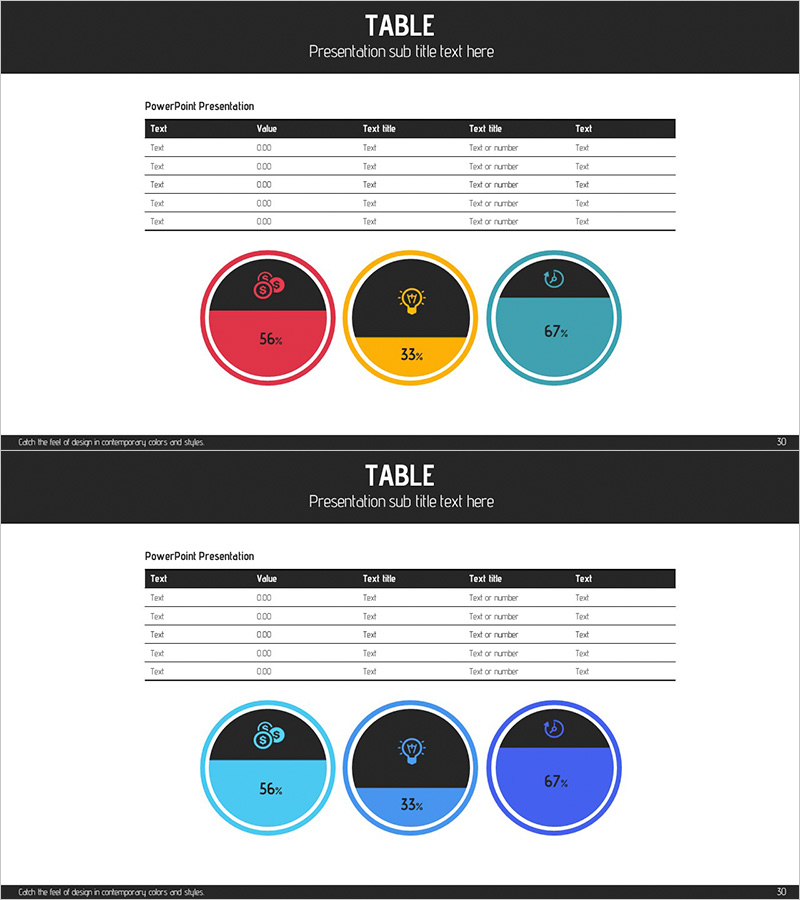
A PowerPoint slide designed for business analysis and idea development stages, visualizing key metrics through three pie charts in red, orange, and teal. The two-tier layout combines a data table at the top with circular charts below, enabling clear numerical comparison and data-driven decision-making. Perfect for investor presentations, business reports, and strategic briefings where analytical findings need to be communicated with precision and visual impact.
Usage Points
-
Main Usage
Enables comparison of three key performance indicators or metrics during business analysis and ideation phases, delivering data-driven insights to stakeholders with visual clarity.
-
How to Use
Input analysis labels and numerical values in the top table; the pie charts automatically display proportional ratios. Maintain the color scheme (red, orange, teal) for consistent brand presentation throughout your deck.
-
Recommended For
Ideal for executives, analysts, and strategists presenting investor pitches, quarterly reports, strategic plans, and marketing proposals where quantitative comparison is essential.
-
Slide Structure
Five-row data table (labels, values, three text columns) plus three pie charts with icons, percentages, and legends. Comprises five text input areas and three comparison charts in a hierarchical information structure.
Related Products
-

Visualizing Product Introduction with App Icon Graph – Innovation and Trends
#Product/Service Introduction #Business Introduction #Graph
-

Musicians and Gauge Charts Slide – The Uniqueness of Data Visualization
#Product/Service Introduction #Business Introduction #Graph
-

Financial Management Analysis Status Graph
#Product/Service Introduction #Business Introduction #Graph
-

Big Data Development Status Analysis Graph – Visualizing Business Strategy
#Product/Service Introduction #Business Introduction #Diagram
