Dot Map Analysis Graph – Global Network and Target Market
RJ0300068_13
- Last Update 05/07/2025
- File Size 2.9MB
- # of Slides 2
- File Format PPTX
- Slide Ratio 16:9
- Color
Keywords
- #Content-Based Slides
- #Design-Based Slides
- #Company Introduction
- #Market and Competitor Analysis
- #Graph
- #Other
- #Global Network
- #Target Market
- #Other
- #Other Charts
- #Map
- #16:9
- #world map PowerPoint slide
- #dot analysis graph
- #global network presentation
- #regional market analysis
- #international business PowerPoint template
About the Product
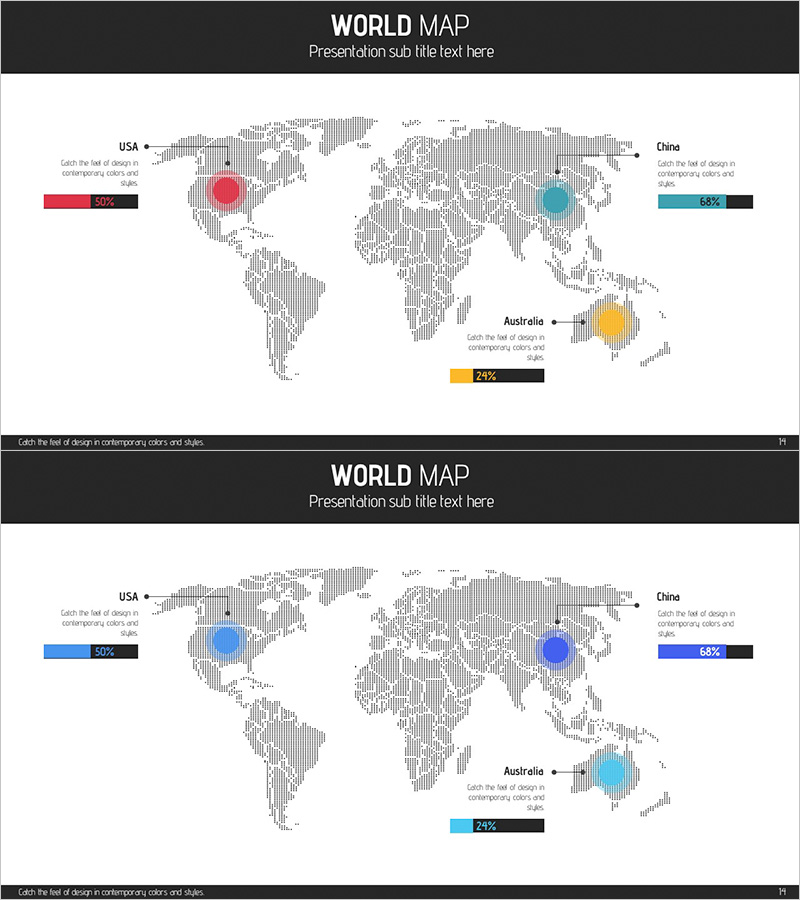
A world map-based dot analysis PowerPoint slide designed to visually represent global business strategy and market distribution. The slide features a gray dotted world map background with three circular nodes in red, blue, yellow, and cyan colors positioned to highlight key markets or regional hubs. Each node is labeled with country names (USA, China, Australia) and percentage data, enabling clear visualization of international market share, regional performance, and global network distribution at a glance. The 2-slide set includes color variations to match different presentation contexts. Provided in 16:9 widescreen PPTX format for immediate editing and customization.
Usage Points
-
Main Usage
Communicate international market expansion strategy, global hub distribution, and regional sales or market share data to executives and investors through map-based dot visualization and numerical indicators.
-
How to Use
Place dot nodes on key geographic locations on the world map, input country names and percentage values, and use in international business presentations, investor pitch decks, and business expansion strategy meetings. Switch between two color versions to match corporate branding or presentation themes.
-
Recommended For
Global marketing managers, international business strategy teams, investor relations (IR) professionals, overseas sales directors, and executives preparing market analysis reports and global expansion presentations requiring visual geographic data representation.
-
Slide Structure
2-slide set. Each slide displays a gray dotted world map background with 3 circular nodes (red, blue, yellow or blue, cyan color schemes) positioned at key regions. Country names and percentage data (50%, 64%, 29%, etc.) are displayed as text labels adjacent to each node. Header and footer areas provide space for title and descriptive text.
Related Products
-

Target Market Goal Map for Global Market Analysis
#Company Introduction #Market and Competitor Analysis #Other
-

Analysis of Global Target Regional Distribution Slide
#Company Introduction #Market and Competitor Analysis #Graph
-

Country-by-Country Bar Chart Analysis – Market Trend Insights
#Company Introduction #Market and Competitor Analysis #Graph
-

Dawn City Theme Global Map
#Company Introduction #Market and Competitor Analysis #Other
