Idea Development Status Graph – Clear Data Visualization with Doughnut Chart
RJ0300068_28
- Last Update 05/07/2025
- File Size 1.3MB
- # of Slides 2
- File Format PPTX
- Slide Ratio 16:9
- Color
Keywords
- #Content-Based Slides
- #Design-Based Slides
- #Product/Service Introduction
- #Market and Competitor Analysis
- #Graph
- #Development Status
- #Market Share
- #Horizontal Bar
- #Circles
- #Horizontal Bar Chart
- #Doughnut Chart
- #16:9
- #doughnut chart PowerPoint slide
- #pie chart template
- #ratio data visualization
- #4-item comparison slide
- #graph PowerPoint template
About the Product
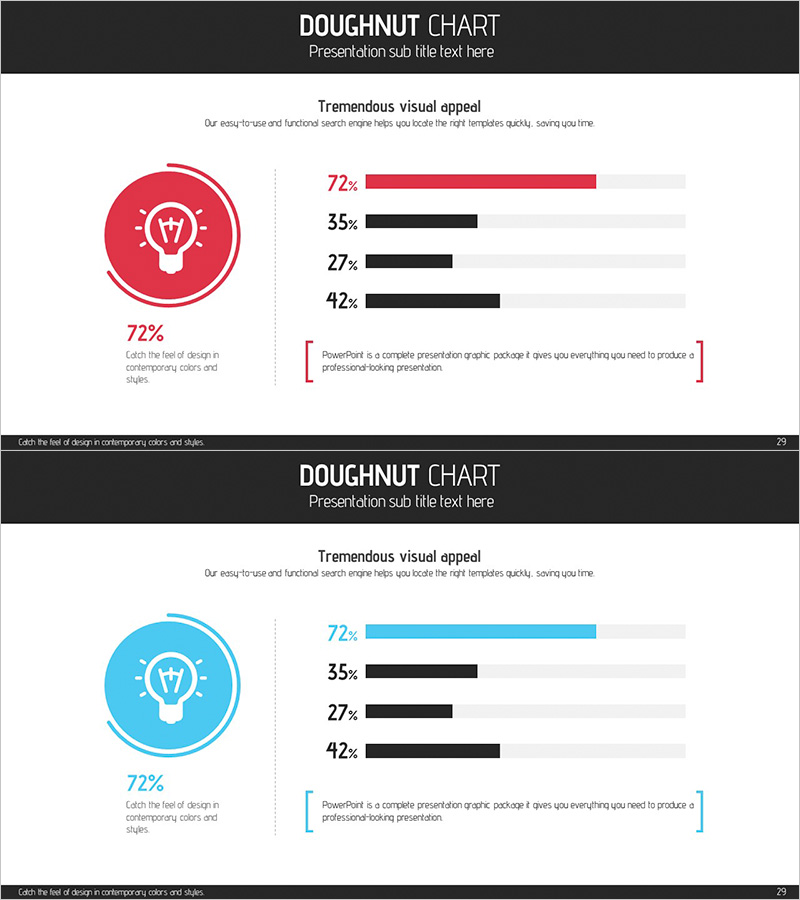
A doughnut chart PowerPoint slide that clearly presents idea development status and data distribution across four categories. The design features a central doughnut chart emphasizing the key metric (72%) with four horizontal bar graphs displaying comparative percentages (72%, 35%, 27%, 42%) on the right side. This layout is ideal for market share analysis, business strategy metrics, project progress tracking, and performance reporting. Available in two color versions—red and blue—in 16:9 widescreen format with 2 slides. Fully editable and ready for immediate use in presentations, reports, and business proposals.
Usage Points
-
Main Usage
Visualize four-category ratio data using a central doughnut chart combined with horizontal bar graphs, enabling clear presentation of quantitative information such as market share, development status, and business metrics.
-
How to Use
Slide 1 features a red color scheme; Slide 2 offers a blue variant. Edit the central 72% metric and doughnut chart segments to reflect your actual data. Modify the four horizontal bars and corresponding labels to match your presentation context and customize colors as needed.
-
Recommended For
Executive reports, business performance presentations, marketing strategy decks, investor pitch decks (IR), and project status updates. Ideal for professionals in management, strategy, finance, and business development who need to present quantitative data with both overview and detailed breakdowns simultaneously.
-
Slide Structure
Each slide contains a doughnut chart on the left (with 72% central metric), four horizontal bar graphs on the right (72%, 35%, 27%, 42%), title and subtitle area at top, and descriptive text box at bottom. Two color themes (red and blue) provided for flexible branding.
Related Products
-

Chemistry Experiment Progress Graph – Visualizing Market Share
#Product/Service Introduction #Market and Competitor Analysis #Graph
-

Analysis of Work Progress – Utilizing Pie Chart
#Product/Service Introduction #Market and Competitor Analysis #Graph
-

Graph of Analysis of Transportation Development Status
#Product/Service Introduction #Market and Competitor Analysis #Graph
-

Business Idea Development Status Graph – Ideas and Growth
#Product/Service Introduction #Market and Competitor Analysis #Graph
