Service Analysis Radial Graph – Market and Competitor Analysis
RJ0300068_20
- Last Update 05/07/2025
- File Size 1.4MB
- # of Slides 2
- File Format PPTX
- Slide Ratio 16:9
- Color
Keywords
- #Content-Based Slides
- #Design-Based Slides
- #Market and Competitor Analysis
- #Diagram
- #Graph
- #Competitor Analysis
- #Market Analysis
- #Cluster
- #Other
- #Chain Diagram
- #Radar Chart Spider Chart
- #16:9
- #radial chart PowerPoint
- #radar chart template
- #5-axis data visualization
- #market analysis slide
- #competitor analysis diagram
- #business presentation chart
- #how to create radial chart in PowerPoint
About the Product
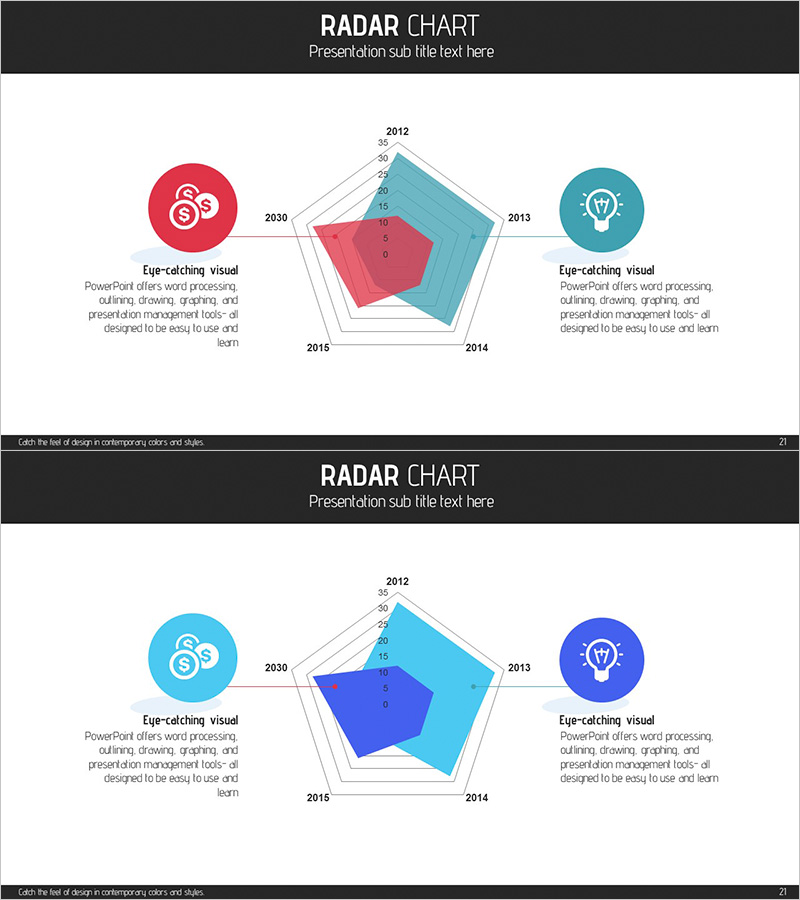
A 5-axis radial chart PowerPoint slide set with 2 slides for comprehensive multi-dimensional data visualization. Perfect for market analysis, competitor benchmarking, and service evaluation presentations. The red-teal dual-tone color scheme creates strong visual contrast, while icon and text areas on both sides enhance information clarity. Ideal for comparing year-over-year trends (2012–2030) or competitive capabilities across multiple metrics. All values, labels, and colors are fully editable, making it suitable for business presentations, marketing plans, strategic reports, and investment pitches.
Usage Points
-
Main Usage
Designed to compare five or more quantitative metrics simultaneously with clarity and impact. Visualize market size, growth rate, market share, customer satisfaction, and competitive strength in a single radial format. Enables quick identification of strengths and weaknesses, supporting strategic decision-making during business planning, competitive analysis, and capability assessment phases.
-
How to Use
Double-click axis labels (years 2012–2030 or evaluation criteria) and values to edit. Adjust transparency and colors of red and teal areas to emphasize comparison intensity between two entities. Customize side icons and descriptions to clarify each metric's meaning. Apply animations aligned with your presentation flow to direct audience attention and enhance engagement.
-
Recommended For
Strategy and planning professionals, marketing managers, executives preparing board reports, management consultants, and investment relations specialists. Ideal for business plans, marketing strategies, executive reports, investment proposals, market research presentations, and competitive analysis documents.
-
Slide Structure
2-slide set. Slide 1: Red-emphasized version with 5-axis radial chart, left-side icon and description, right-side icon and description. Slide 2: Teal-emphasized version with identical layout and reversed color focus. Each axis scales 0–35 with 5 concentric circles and 5 nodes, enabling precise data input and professional-grade visualization.
Related Products
-

Data Analysis Graph Visualization for Market Competition
#Market and Competitor Analysis #Diagram #Graph
-

Fintech Market Analysis Bar Graph – Clear Data Visualization
#Market and Competitor Analysis #Diagram #Graph
-

Competitor Growth Comparison Radial Chart
#Market and Competitor Analysis #Graph #Competitor Analysis
-

Market Distribution Comparison Graph – Trends and Analysis
#Market and Competitor Analysis #Diagram #Graph
