Target Area Status Analysis Graph
RJ0300068_23
- Last Update 05/07/2025
- File Size 1.7MB
- # of Slides 2
- File Format PPTX
- Slide Ratio 16:9
- Color
Keywords
- #Content-Based Slides
- #Design-Based Slides
- #Market and Competitor Analysis
- #Marketing Plan and Strategy
- #Graph
- #Other
- #Target Market
- #Target Market Strategy
- #Horizontal Bar
- #Horizontal Bar Chart
- #Map
- #16:9
- #Asian map PowerPoint slide
- #world map presentation template
- #regional analysis chart
- #target area data visualization
- #market analysis PPT download
About the Product
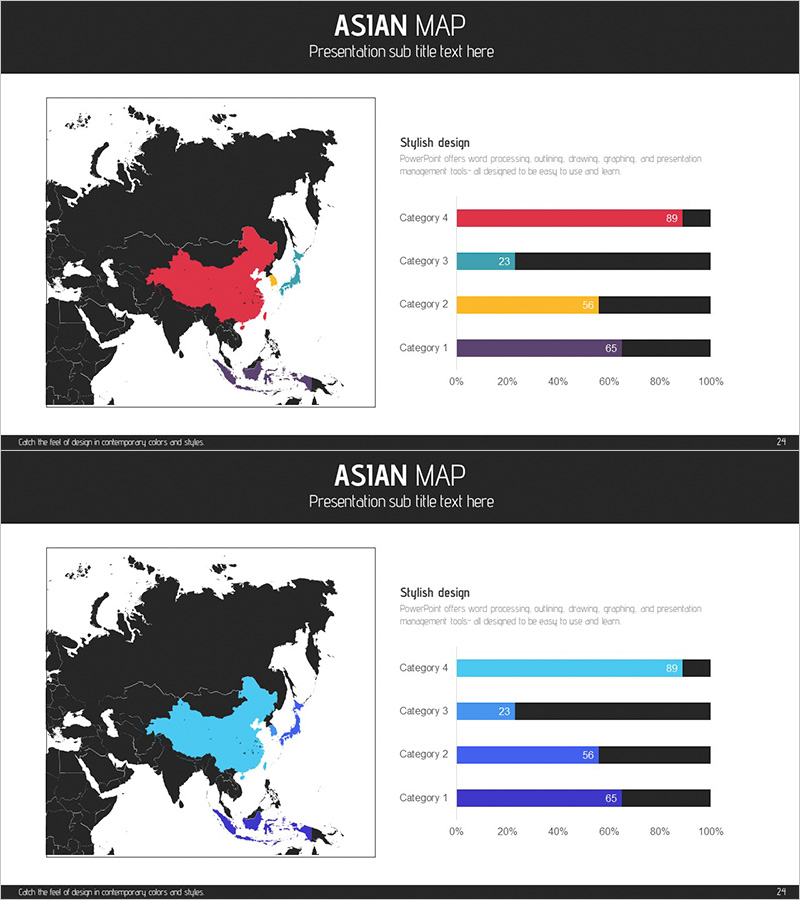
A 2-slide PowerPoint presentation featuring a world map with Asia highlighted in distinct colors, paired with horizontal bar charts showing category-wise regional analysis. The dark background with red, blue, yellow, and purple regional highlights creates strong visual contrast for target area market analysis. Each slide displays the geographic map on the left and four category comparison bars on the right, enabling quick assessment of regional market status. Delivered in 16:9 widescreen PPTX format, fully editable and ready for business presentations, marketing strategy documents, and market analysis reports.
Usage Points
-
Main Usage
Visualize regional market status and compare data across Asian territories using an interactive world map combined with horizontal bar charts. The design emphasizes target regions while displaying four category metrics simultaneously, making it ideal for regional marketing strategy development and competitive analysis.
-
How to Use
Modify the map's highlighted regions to focus on different areas, and update the chart categories, values, and colors to match your dataset. Both slides share the same layout with different color schemes, allowing you to select the version that best fits your presentation context and brand guidelines.
-
Recommended For
Marketing managers, strategic planners, sales directors, and market analysts presenting regional performance data. Perfect for business plans, marketing strategy documents, market analysis reports, and investor pitch decks where regional comparison is essential.
-
Slide Structure
Each slide features a two-column layout: the left side displays a world map with Asia highlighted in color against a black background with white borders, while the right side shows four horizontal bar charts (Category 1–4) stacked vertically. Each bar includes color-coded segments and numeric labels for easy data interpretation.
Related Products
-

Analysis of US Target Regions - Effective Market Exploration
#Market and Competitor Analysis #Marketing Plan and Strategy #Other
-

Worldwide Marketing Strategy Visualized on Map
#Market and Competitor Analysis #Marketing Plan and Strategy #Other
-

U.S. Target Region Distribution – Market Analysis
#Market and Competitor Analysis #Marketing Plan and Strategy #Graph
-

US Target Market Strategy – Data-Driven Market Analysis
#Market and Competitor Analysis #Marketing Plan and Strategy #Other
