Summary Analysis Bar Chart Bundle – Optimal for Market Competitor Analysis
RJ0300068_22
- Last Update 05/07/2025
- File Size 1.2MB
- # of Slides 2
- File Format PPTX
- Slide Ratio 16:9
- Color
Keywords
- #Content-Based Slides
- #Design-Based Slides
- #Market and Competitor Analysis
- #Graph
- #Competitor Analysis
- #Competitive Advantage
- #Horizontal Bar
- #Grouped Horizontal Bar
- #16:9
- #grouped bar chart PowerPoint
- #horizontal bar chart template
- #3-series comparison slide
- #time-series data visualization
- #competitor analysis PowerPoint slide
About the Product
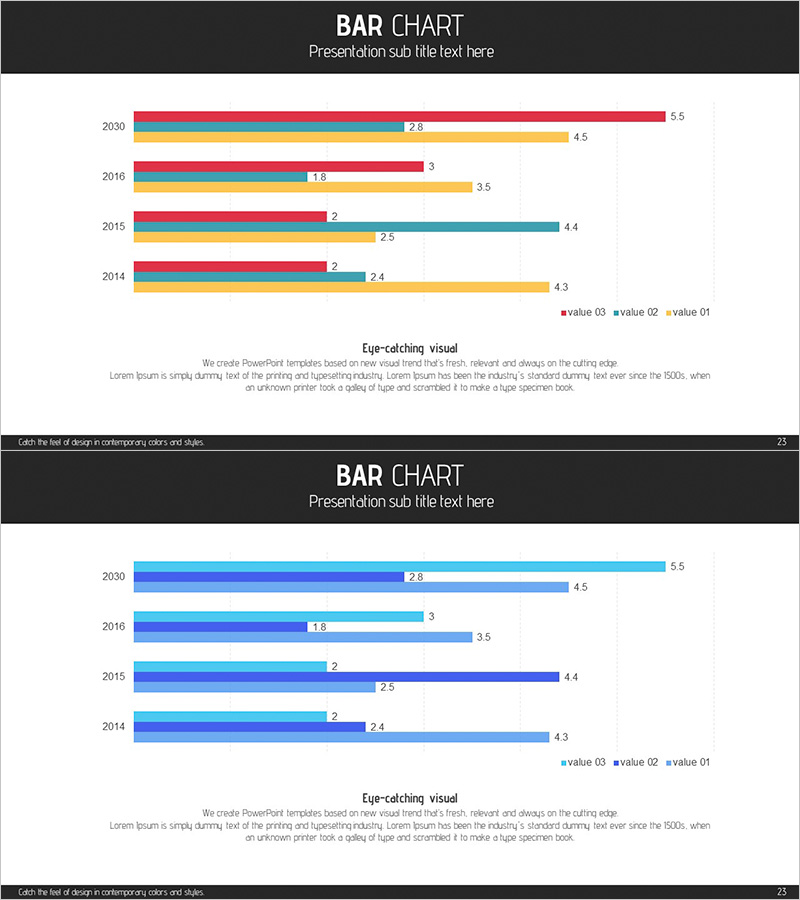
A PowerPoint slide featuring a grouped horizontal bar chart comparing three data series across five years (2014–2030). Each year displays three color-coded bars (red, yellow, and blue, or blue-tone variants) representing different metrics, enabling simultaneous visualization of temporal trends and inter-series comparisons. Ideal for market competitor analysis, sales performance benchmarking, and KPI trend presentations. Fully editable in 16:9 widescreen format, PPTX file type, 2-slide deck ready for immediate use in business reports, pitch decks, and financial summaries.
Usage Points
-
Main Usage
Designed to compare numerical data across years and series at a glance, revealing trends and performance gaps. Ideal for presenting competitor metrics, departmental revenue, product-line market share, or any scenario requiring three or more items compared over time.
-
How to Use
Input your data values into the three bars for each year row and adjust colors as needed. Insert into market analysis, business performance, or financial sections of presentations, business plans, or investor pitch decks to strengthen quantitative evidence and credibility.
-
Recommended For
Executives, marketing teams, sales departments, finance teams, consultants, and analysts relying on data-driven decision-making. Particularly effective for competitive benchmarking, market share analysis, multi-year performance reviews, and investor communications.
-
Slide Structure
2-slide deck. Each slide contains a grouped horizontal bar chart with 5 years (2014–2030) on the Y-axis and 3 color-coded series (value 01, value 02, value 03). Data labels appear at bar ends, with legend and descriptive text areas included for context.
Related Products
-

Blue Green Graph Numerical Change Analysis – Ideal for Market and Competitive Analysis Presentation
#Market and Competitor Analysis #Diagram #Graph
-

Vertical Bar Chart Slide for Data Comparison
#Market and Competitor Analysis #Graph #Competitor Analysis
-

Slide Emphasizing Social Service Strengths through Competitive Analysis
#Market and Competitor Analysis #Graph #Text Box
-

Carbon Neutral Competitive Advantage Horizontal Chart
#Market and Competitor Analysis #Graph #Competitor Analysis
