Market Analysis with Horizontal Stacked Bar Graph – Visualizing Competitive Advantage
RJ0300068_7
- Last Update 05/07/2025
- File Size 1.4MB
- # of Slides 2
- File Format PPTX
- Slide Ratio 16:9
- Color
Keywords
- #Content-Based Slides
- #Design-Based Slides
- #Market and Competitor Analysis
- #Graph
- #Competitor Analysis
- #Market Analysis
- #Horizontal Bar
- #Segmented Horizontal Bar
- #16:9
- #stacked bar chart PowerPoint
- #horizontal bar graph slide
- #2-series comparison template
- #competitive analysis chart
- #market analysis PowerPoint slide
About the Product
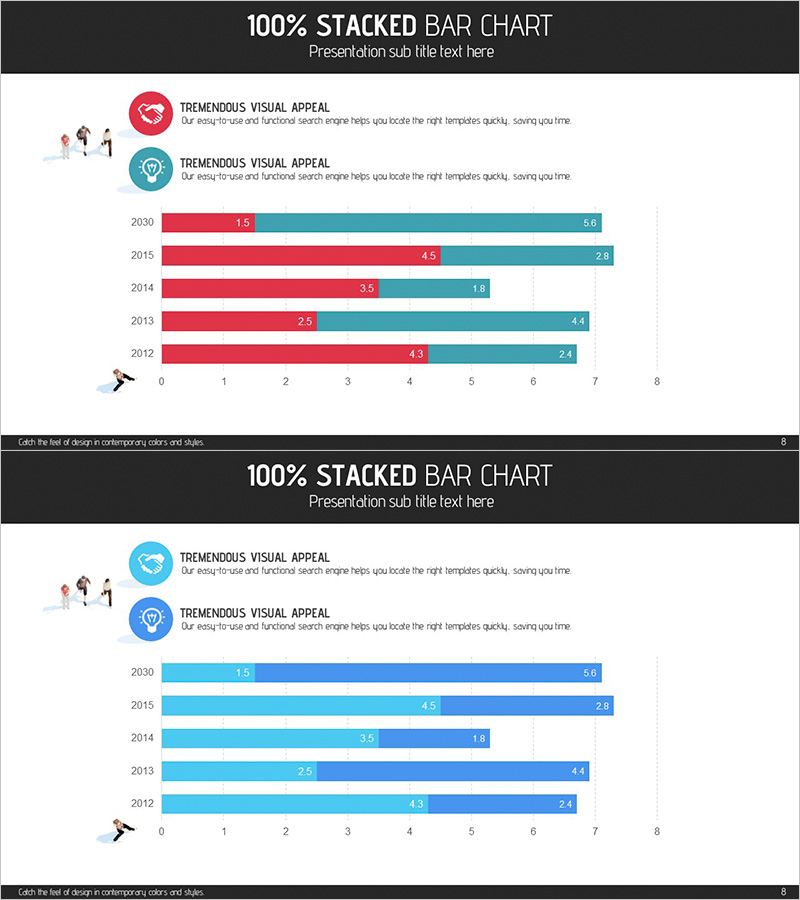
A 100% stacked horizontal bar chart PowerPoint slide comparing two data series across five years (2012–2030). The design uses red and teal colors to clearly distinguish between two metrics, with numerical labels on each bar segment for precise value comparison. Icons and descriptive text explain the meaning of each series, making it ideal for market analysis, competitive positioning, and performance tracking in business presentations. This slide template works seamlessly in reports, proposals, and investor pitches where side-by-side data comparison is essential.
Usage Points
-
Main Usage
Displays two metrics side-by-side across multiple time periods to reveal competitive advantage, market share shifts, and performance trends at a glance. The red-and-teal color scheme ensures clear visual distinction between series, while numerical labels enable precise value comparison.
-
How to Use
Insert this slide into the market analysis, competitive positioning, or performance review sections of your presentation. Replace existing data with your own figures, and the bar segments automatically adjust. Customize colors, years, and category labels to fit your specific analysis needs.
-
Recommended For
Marketing managers, strategy planners, sales directors, and financial analysts presenting competitive analysis, market trends, or departmental performance comparisons. Ideal for business plans, quarterly reports, investor presentations, and strategic reviews.
-
Slide Structure
2-slide set. Slide 1: Title slide with two icons and descriptive text. Slide 2: 100% stacked horizontal bar chart with 5 rows (2012–2030, 5-year intervals). Each row contains a red bar segment (1.5–4.5 range) and teal segment (1.8–5.6 range). Horizontal axis scales 0–8 with numerical labels on each segment.
Related Products
-

Horizontal Bar Graph Broken Down by Year – Optimal for Market and Competitor Analysis
#Market and Competitor Analysis #Graph #Competitor Analysis
-

Market Analysis Bar Graph – Effective Visualization for Competitor Analysis
#Market and Competitor Analysis #Graph #Competitor Analysis
-

Comparative Analysis Graph – Optimal Tool for Market and Competitor Analysis
#Market and Competitor Analysis #Graph #Competitor Analysis
-

Blue Green Subdivided Graph – Template for Market and Competitor Analysis
#Market and Competitor Analysis #Graph #Competitor Analysis
