Bar Graph for Competitor Analysis – Business Advantage
RJ0300061_14
- Last Update 05/04/2025
- File Size 0.2MB
- # of Slides 2
- File Format PPTX
- Slide Ratio 16:9
- Color
Keywords
- #Content-Based Slides
- #Design-Based Slides
- #Market and Competitor Analysis
- #Graph
- #Competitor Analysis
- #Competitive Advantage
- #Horizontal Bar
- #Double Horizontal Bar
- #16:9
- #horizontal bar chart PowerPoint
- #competitor analysis slide
- #5-category comparison chart
- #market analysis PowerPoint
- #business advantage visualization
About the Product
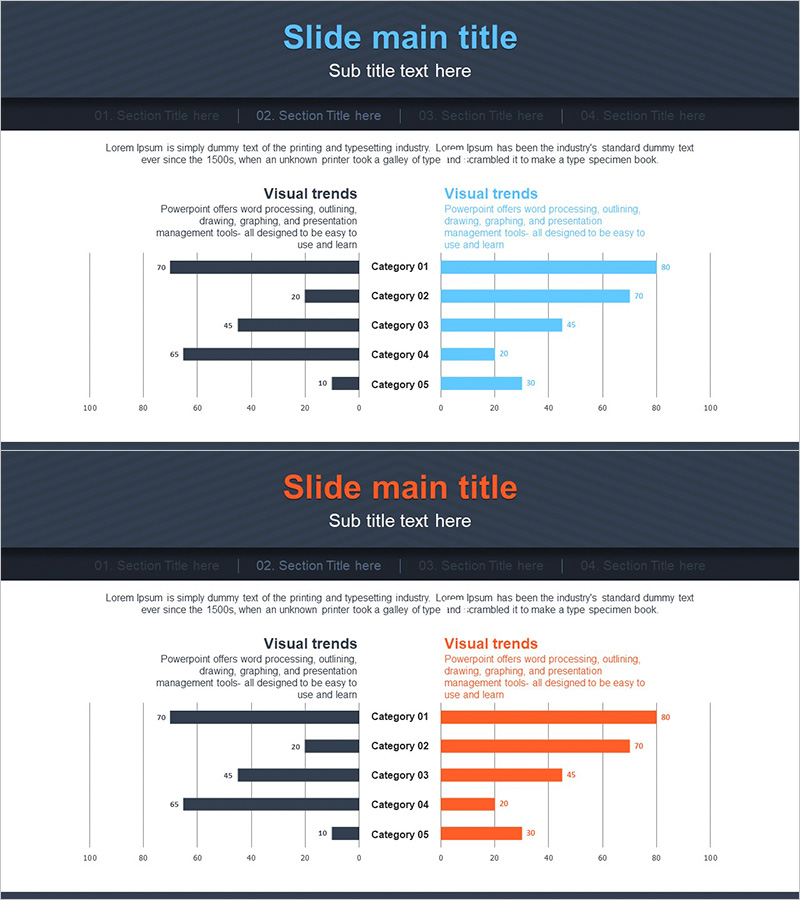
A horizontal bar chart PowerPoint slide designed for competitor analysis and market advantage comparison. The slide uses a contrasting two-tone color scheme of dark navy and sky blue, with five data categories arranged in a left-right symmetrical layout to visually represent competitive relationships. The 2-slide set features the same layout with different color combinations (navy-blue and navy-orange) to illustrate multiple analytical perspectives. This presentation slide is ready to use in pitch decks, business reports, and strategic briefings.
Usage Points
-
Main Usage
Visualize competitor analysis, market positioning, and business performance benchmarking. The symmetrical left-right layout clearly shows competitive relationships while enabling simultaneous comparison of five category items.
-
How to Use
Insert into proposal decks, business reports, and executive briefing presentations in the competitive analysis section. Edit bar values to input actual data and modify color combinations to represent different analytical scenarios.
-
Recommended For
Marketing professionals, strategy planning teams, and sales executives presenting competitive analysis. Ideal for new business proposals, market entry strategies, and product positioning discussions.
-
Slide Structure
2-slide set. Each slide displays 5 categories with dark navy bars on the left and colored bars (blue or orange) on the right in symmetrical arrangement to emphasize comparison. Includes 0-100 scale axis and numerical labels.
Related Products
-

Business Bi-level Bar Graph – Optimized for Competitor Analysis
#Market and Competitor Analysis #Graph #Competitor Analysis
-

Gender Ratio Bar Graph – Market and Competitor Analysis
#Market and Competitor Analysis #Graph #Competitor Analysis
-

Competitive Comparison Analysis Bar Graph – Visualizing Market Advantage
#Market and Competitor Analysis #Graph #Competitor Analysis
-

Competitive Advantage 3D Bi-directional Bar Graph – Essential Tool for Market Analysis
#Market and Competitor Analysis #Graph #Competitor Analysis
