Business Evaluation Table – Operation Plan and Aftercare
RJ0300061_28
- Last Update 05/05/2025
- File Size 0.2MB
- # of Slides 2
- File Format PPTX
- Slide Ratio 16:9
- Color
Keywords
- #Content-Based Slides
- #Design-Based Slides
- #Operational Plan
- #Diagram
- #Post-Implementation Management & Maintenance
- #Table
- #Standard Table
- #16:9
- #business evaluation table PowerPoint
- #operation plan slide template
- #evaluation form PPT
- #table diagram PowerPoint slide
- #project management checklist presentation
About the Product
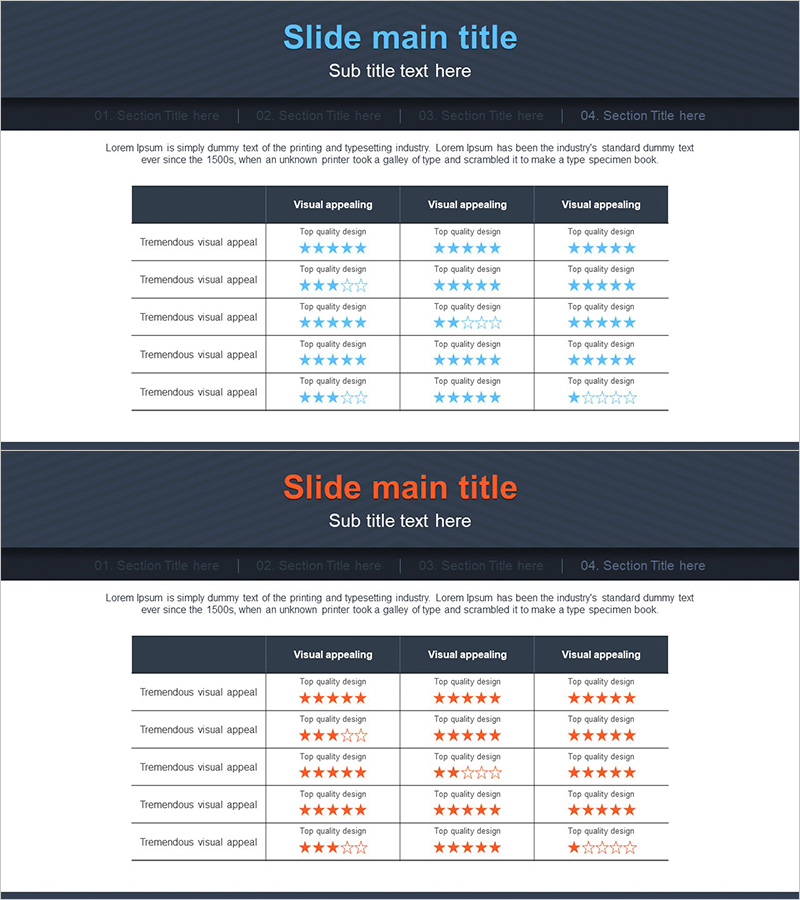
A PowerPoint slide set for business evaluation and operation plan management featuring a table-based layout. The design includes a dark gray header and white input areas organized in a 3-column by 5-row table structure, allowing you to clearly organize evaluation items, criteria, and scores. The 2-slide PowerPoint deck features identical table layouts where you can insert text and star rating icons in each cell to express both qualitative and quantitative assessments. This presentation template is ready to use for business performance evaluation, operational results management, post-project checklists, and other professional documents requiring systematic data organization.
Usage Points
-
Main Usage
Express business performance evaluation, operation planning, and post-project management checklists using a table format to systematically organize data, enable comparative analysis, and support decision-making in professional presentations.
-
How to Use
Enter evaluation items in each row and input evaluation criteria and scores in the columns. Use star rating icons to visualize qualitative assessments and apply color emphasis to highlight important items. Insert the slides into business plans, reports, and proposals to clearly communicate operational status and performance metrics.
-
Recommended For
Project managers, operations specialists, quality assurance teams, and business development professionals presenting performance evaluations, progress reviews, and risk management. Ideal for inclusion in business plans, operational reports, and proposal documents requiring structured data presentation.
-
Slide Structure
2-slide presentation with identical layouts. Each slide features a dark gray header (3 columns) and white input areas (5 rows) organized in table format. The first column contains evaluation items, while the second and third columns serve as input areas for evaluation criteria and scores, with star rating icons placed in cells to represent quantitative assessments.
Related Products
-

Korean Traditional Culture Table - Emphasizing Operational Planning and Management Efficiency
#Operational Plan #Diagram #Organizational Structure and Staffing Plan
-

Effort and Performance Table Chart – Optimizing Operational Planning
#Operational Plan #Diagram #Capital Investment Plan
-

Blue Orange Checklist – Diagram for Operational Planning
#Operational Plan #Diagram #Capital Investment Plan
-

Facility Management Plan Chart – Optimizing Operations and Investments
#Operational Plan #Diagram #Capital Investment Plan
